Switching between plotting libraries lets you leverage their unique strengths. However, learning multiple specific APIs can significantly increase your cognitive load.
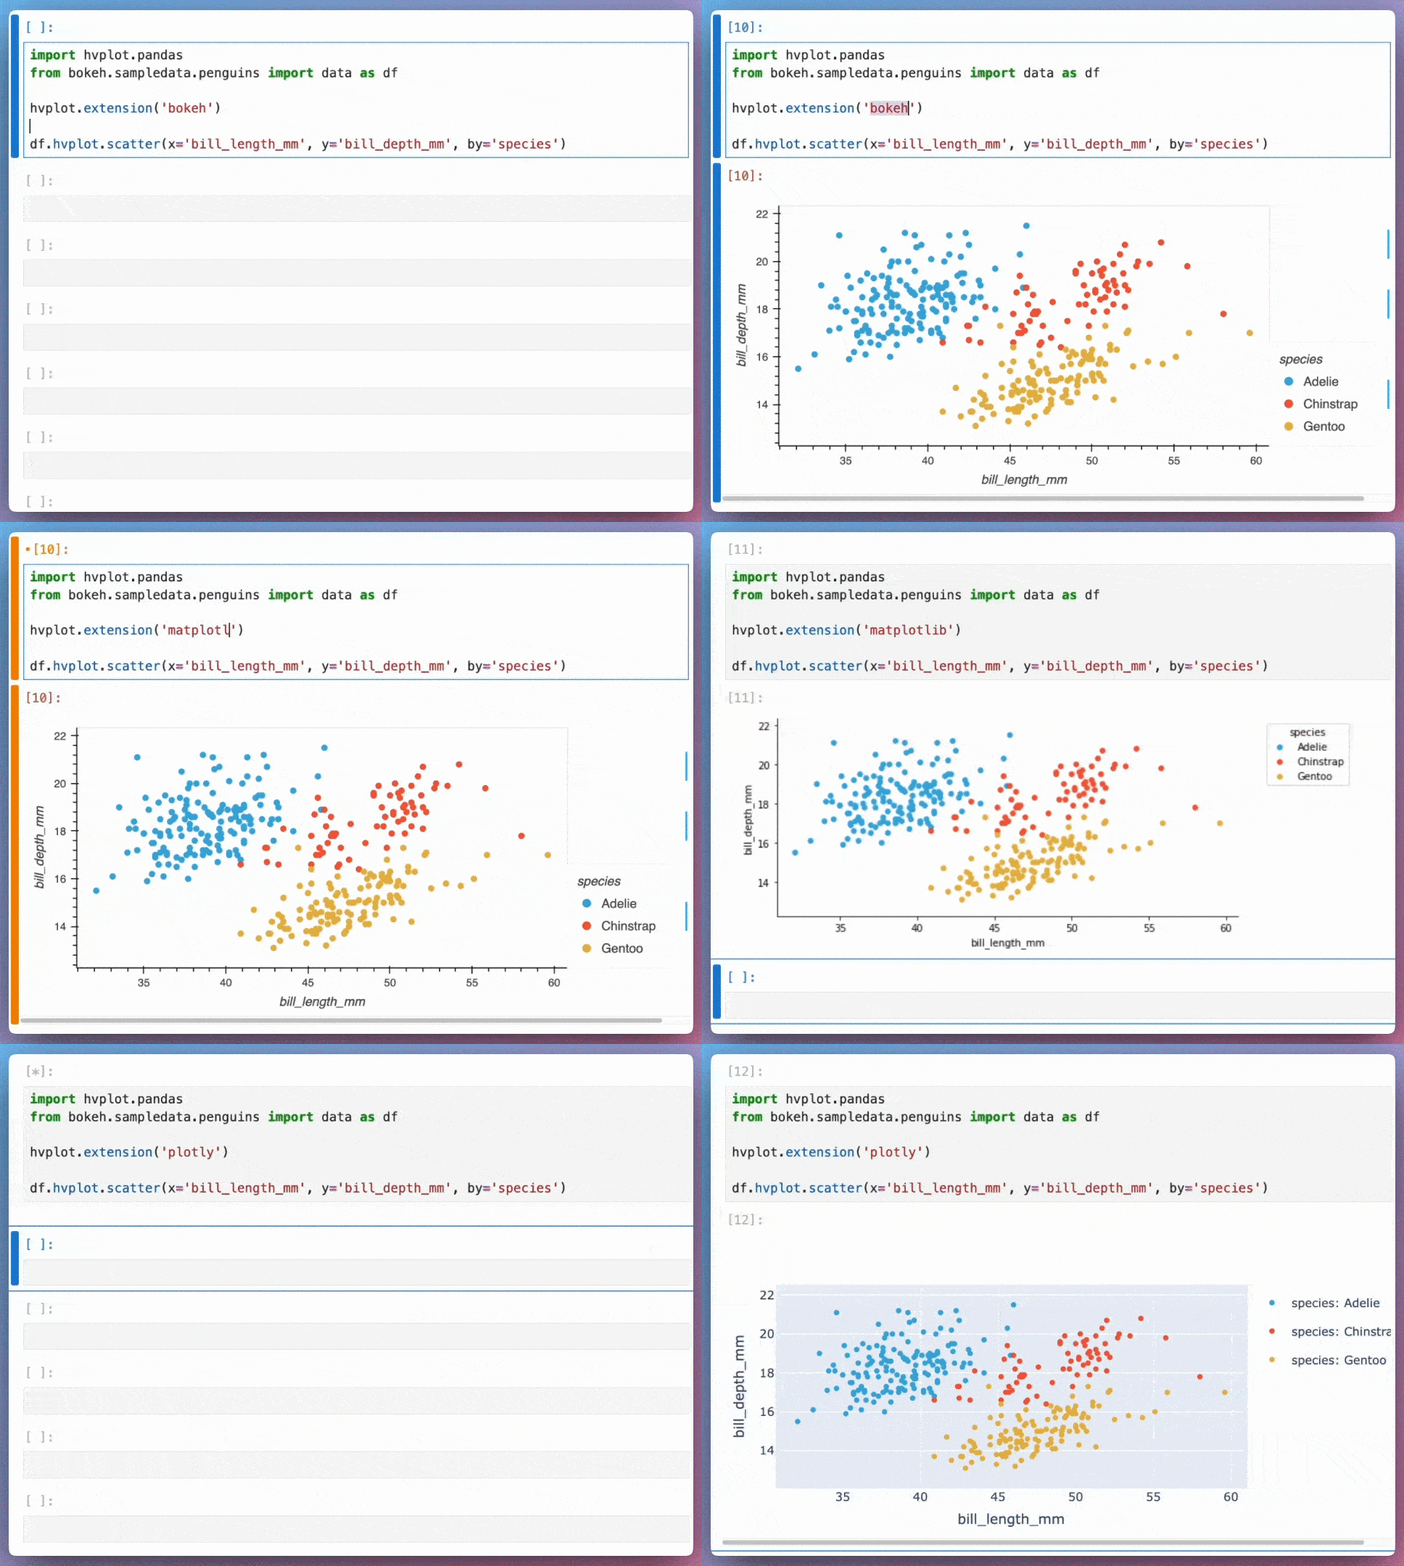
hvPlot provides a unified, high-level API that allows using the same syntax for Bokeh, Matplotlib, and Plotly. Here’s an example of how hvPlot can be used with different backends:
import hvplot.pandas
from bokeh.sampledata.penguins import data as df

# Default (Bokeh)
df.hvplot.scatter(x='bill_length_mm', y='bill_depth_mm', by='species')

# Matplotlib
hvplot.extension('matplotlib')
df.hvplot.scatter(x='bill_length_mm', y='bill_depth_mm', by='species')

# Plotly
hvplot.extension('plotly')
df.hvplot.scatter(x='bill_length_mm', y='bill_depth_mm', by='species')
This allows data scientists to create visualizations using a familiar API while leveraging the strengths of different plotting libraries.


