EDA is a crucial step in any Data Science project. For large datasets, EDA can be time-consuming.
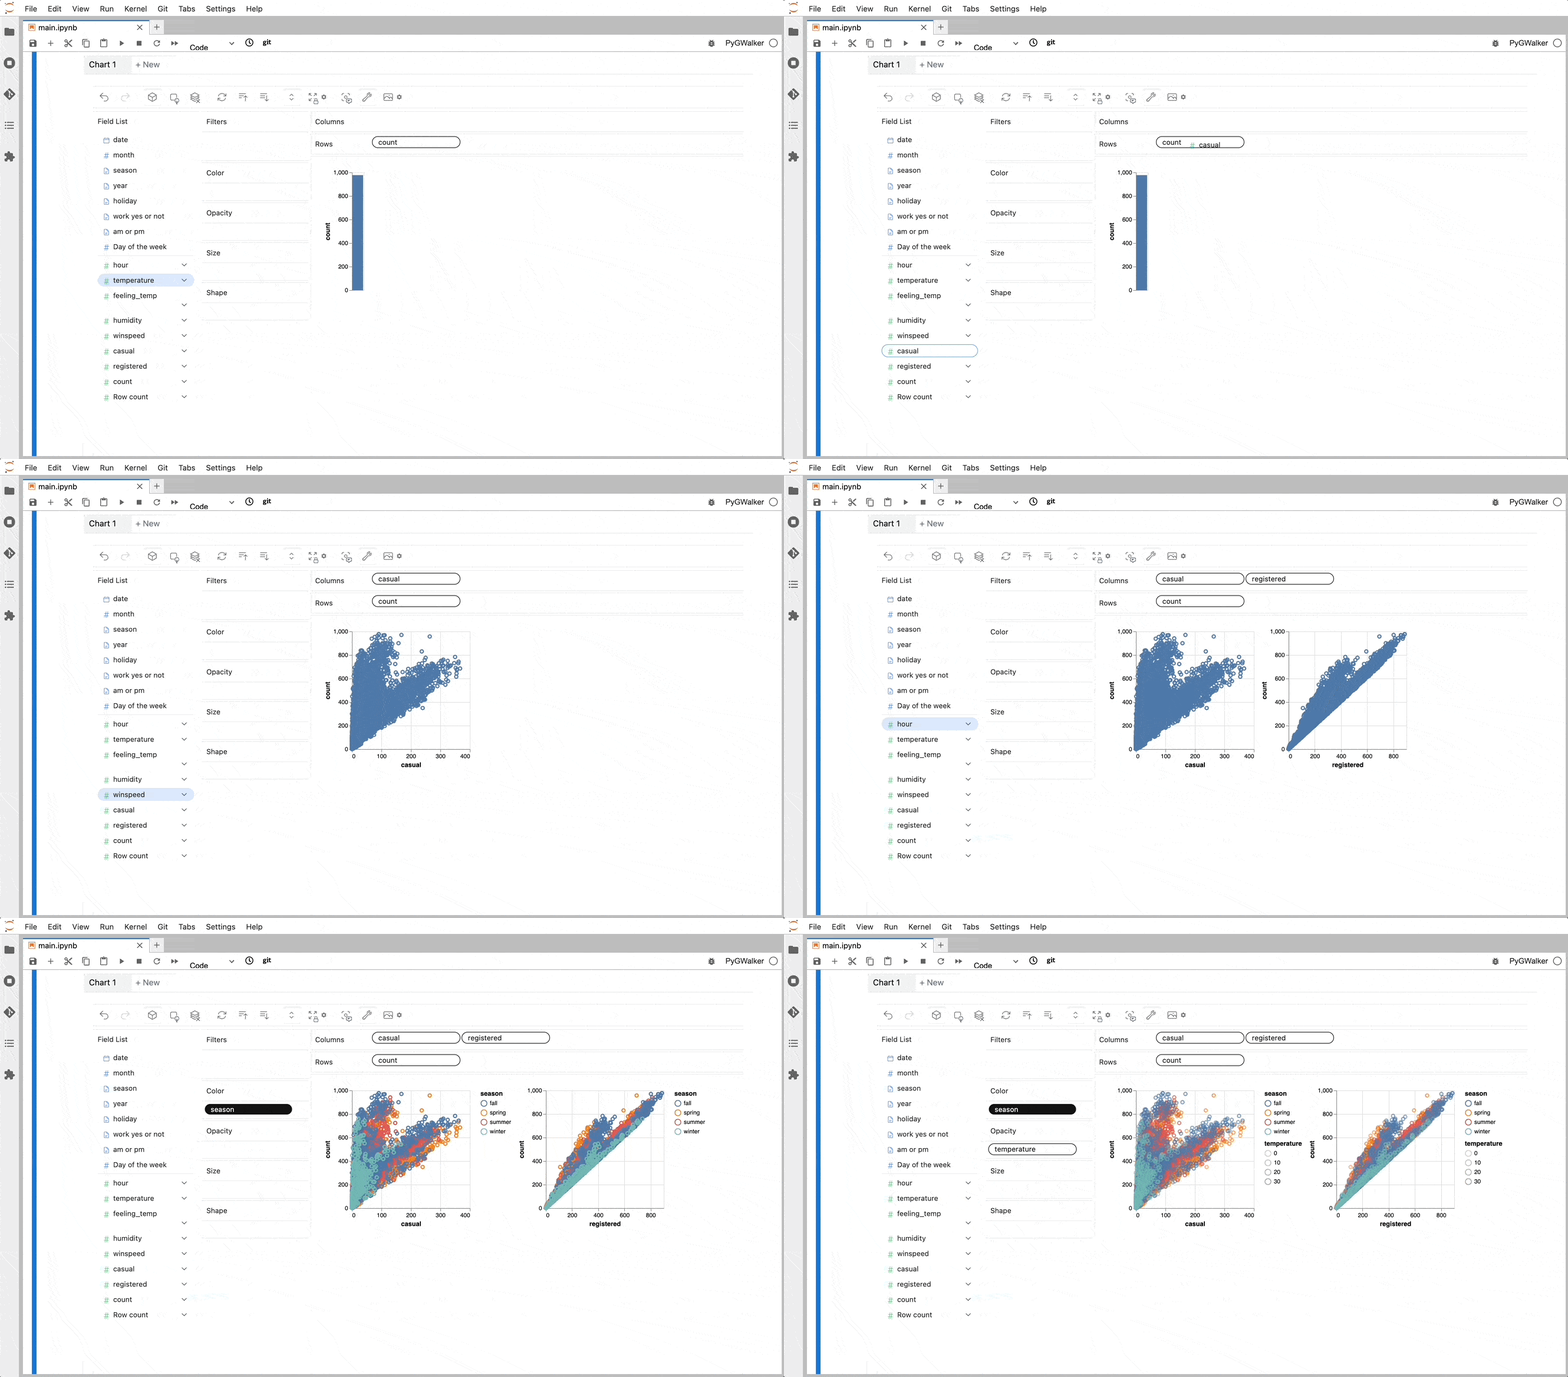
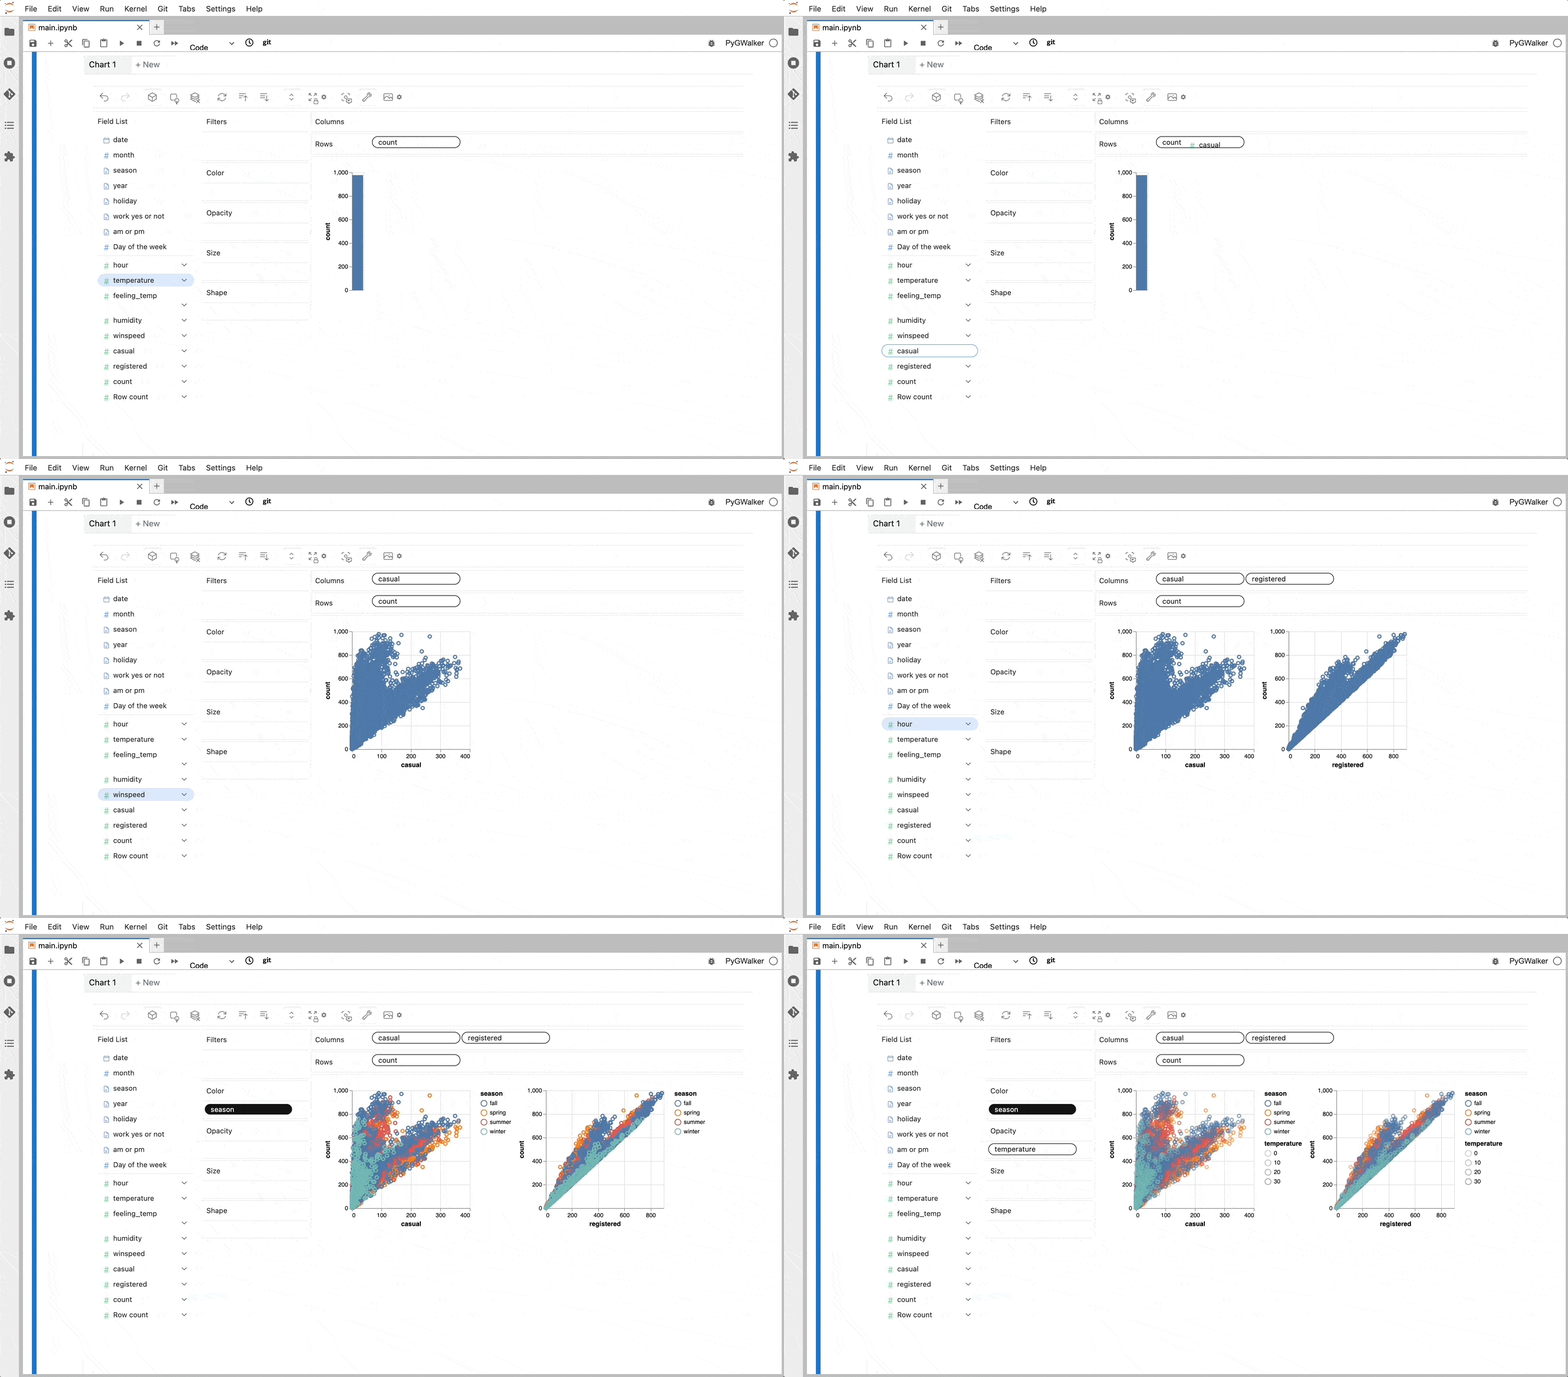
PyGWalker simplifies the process of creating visualizations by allowing users to drag and drop variables to create charts without writing much code.
You can use PyGWalker without changing your existing workflow. For example, you can call up PyGWalker with the Dataframe loaded in this way:
import pygwalker as pyg
import pandas as pd

df = pd.read_csv("https://kanaries-app.s3.ap-northeast-1.amazonaws.com/public-datasets/bike_sharing_dc.csv", parse_dates=['date'])
df.head(10)
Output:
        date  month  season  hour  year holiday  temperature  feeling_temp  \
0 2011-01-01      1  winter     0  2011      no         3.28        3.0014
1 2011-01-01      1  winter     1  2011      no         2.34        1.9982
2 2011-01-01      1  winter     2  2011      no         2.34        1.9982
3 2011-01-01      1  winter     3  2011      no         3.28        3.0014
4 2011-01-01      1  winter     4  2011      no         3.28        3.0014

   humidity  winspeed  casual  registered  count  work yes or not am or pm  \
0      81.0       0.0       3          13     16                0       am
1      80.0       0.0       8          32     40                0       am
2      80.0       0.0       5          27     32                0       am
3      75.0       0.0       3          10     13                0       am
4      75.0       0.0       0           1      1                0       am

   Day of the week
0                6
1                6
2                6
3                6
4                6
And then just walk around!
