Generic selectors
Exact matches only
Search in title
Search in content
Post Type Selectors
Filter by Categories
About Article
Analyze Data
Archive
Best Practices
Better Outputs
Blog
Code Optimization
Code Quality
Command Line
Daily tips
Dashboard
Data Analysis & Manipulation
Data Engineer
Data Visualization
DataFrame
Delta Lake
DevOps
DuckDB
Environment Management
Feature Engineer
Git
Jupyter Notebook
LLM
LLM
Machine Learning
Machine Learning
Machine Learning & AI
Manage Data
MLOps
Natural Language Processing
NumPy
Pandas
Polars
PySpark
Python Tips
Python Utilities
Python Utilities
Scrape Data
SQL
Testing
Time Series
Tools
Visualization
Visualization & Reporting
Workflow & Automation
Workflow Automation

Analyze the Memory Usage of Your Python Code

Table of Contents

Analyze the Memory Usage of Your Python Code

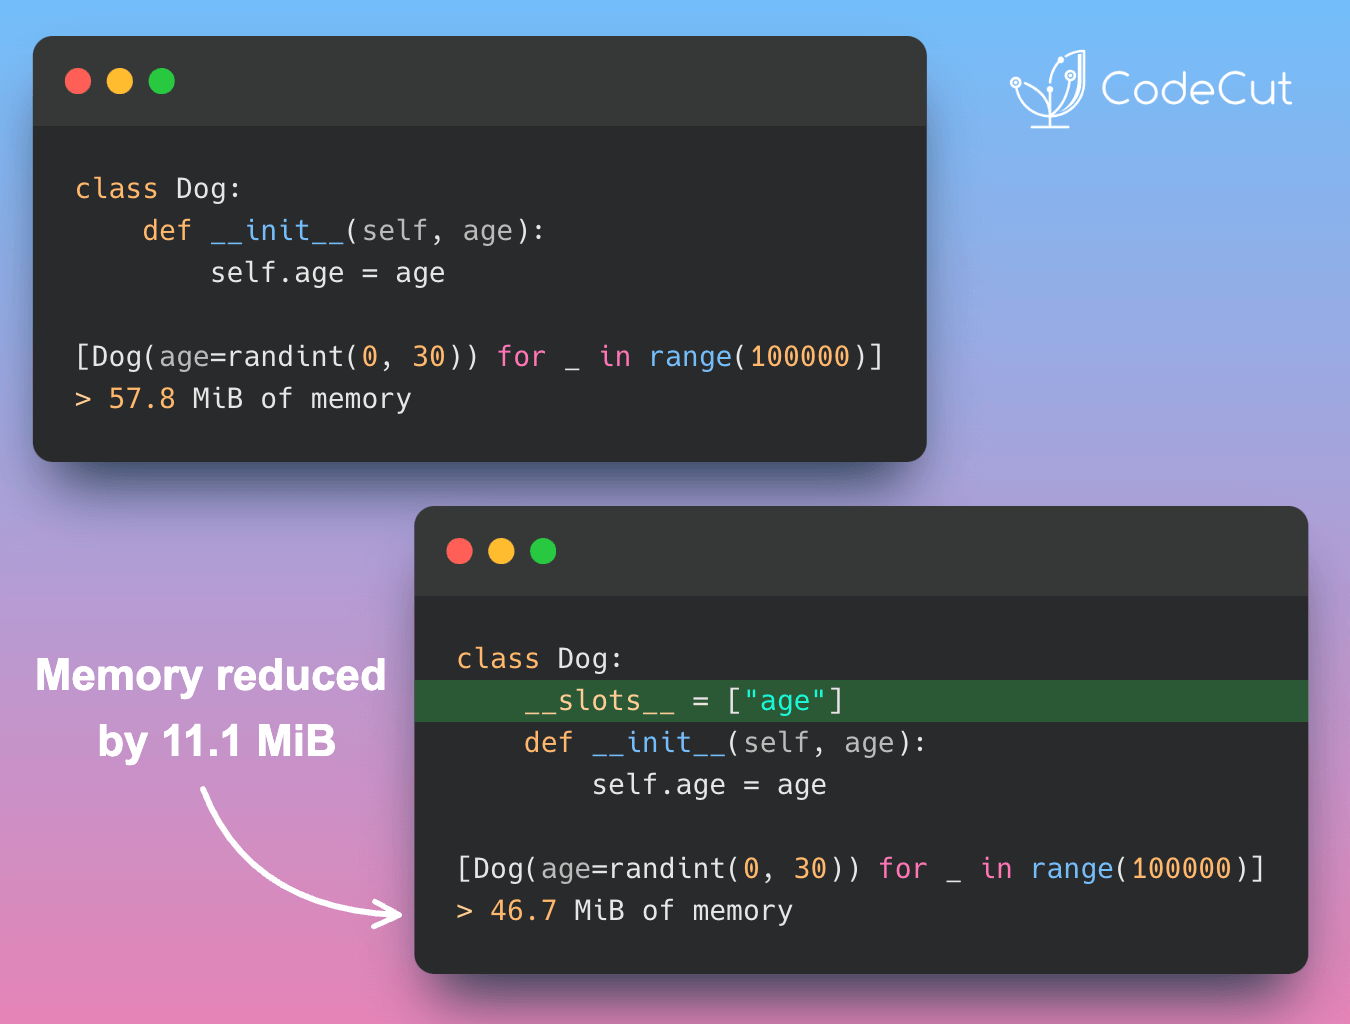
If you want to analyze the memory consumption of your Python code line-by-line, use memory_profiler. This package allows you to generate a full memory usage report of your executable and plot it.

Link to memory_profiler.

My previous tips on tools for code review.

Leave a Comment

Your email address will not be published. Required fields are marked *

Scroll to Top

Work with Khuyen Tran

Work with Khuyen Tran