Generic selectors
Exact matches only
Search in title
Search in content
Post Type Selectors
Filter by Categories
About Article
Analyze Data
Archive
Best Practices
Better Outputs
Blog
Code Optimization
Code Quality
Command Line
Daily tips
Dashboard
Data Analysis & Manipulation
Data Engineer
Data Visualization
DataFrame
Delta Lake
DevOps
DuckDB
Environment Management
Feature Engineer
Git
Jupyter Notebook
LLM
LLM
Machine Learning
Machine Learning
Machine Learning & AI
Manage Data
MLOps
Natural Language Processing
NumPy
Pandas
Polars
PySpark
Python Tips
Python Utilities
Python Utilities
Scrape Data
SQL
Testing
Time Series
Tools
Visualization
Visualization & Reporting
Workflow & Automation
Workflow Automation

hvPlot: One Syntax for Bokeh, Matplotlib, and Plotly

Table of Contents

hvPlot: One Syntax for Bokeh, Matplotlib, and Plotly

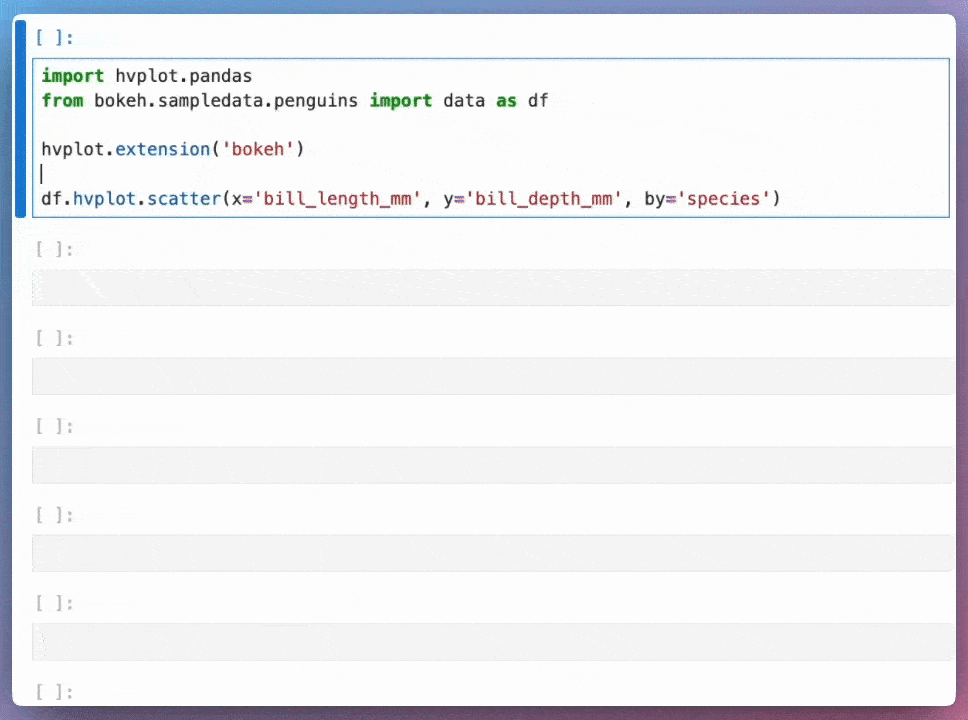
Switching between plotting libraries lets you leverage their unique strengths. However, learning multiple specific APIs can significantly increase your cognitive load.

hvPlot provides a unified, high-level API that allows using the same syntax for Bokeh, Matplotlib, and Plotly. Here’s an example of how hvPlot can be used with different backends:

import hvplot.pandas
from bokeh.sampledata.penguins import data as df

# Default (Bokeh)
df.hvplot.scatter(x='bill_length_mm', y='bill_depth_mm', by='species')

# Matplotlib
hvplot.extension('matplotlib')
df.hvplot.scatter(x='bill_length_mm', y='bill_depth_mm', by='species')

# Plotly
hvplot.extension('plotly')
df.hvplot.scatter(x='bill_length_mm', y='bill_depth_mm', by='species')

This allows data scientists to create visualizations using a familiar API while leveraging the strengths of different plotting libraries.

Link to hvPlot.

Leave a Comment

Your email address will not be published. Required fields are marked *

Scroll to Top

Work with Khuyen Tran

Work with Khuyen Tran