
Venn diagrams are a great way to visualize the relationships between sets, and with Python, you can easily create them using the matplotlib-venn library. In this post, we’ll explore how to create Venn diagrams using matplotlib-venn and provide some examples to get you started.
Installing Matplotlib-Venn
Before you can start creating Venn diagrams, you’ll need to install the matplotlib-venn library. You can do this using pip:
pip install matplotlib-vennCreating a Venn Diagram with Two Circles
To create a Venn diagram with two circles, you can use the venn2 function from matplotlib-venn. This function takes two main arguments: subsets and set_labels. The subsets argument specifies the size of each region in the Venn diagram, while the set_labels argument specifies the labels for each set.
Here’s an example of how to create a Venn diagram with two circles:
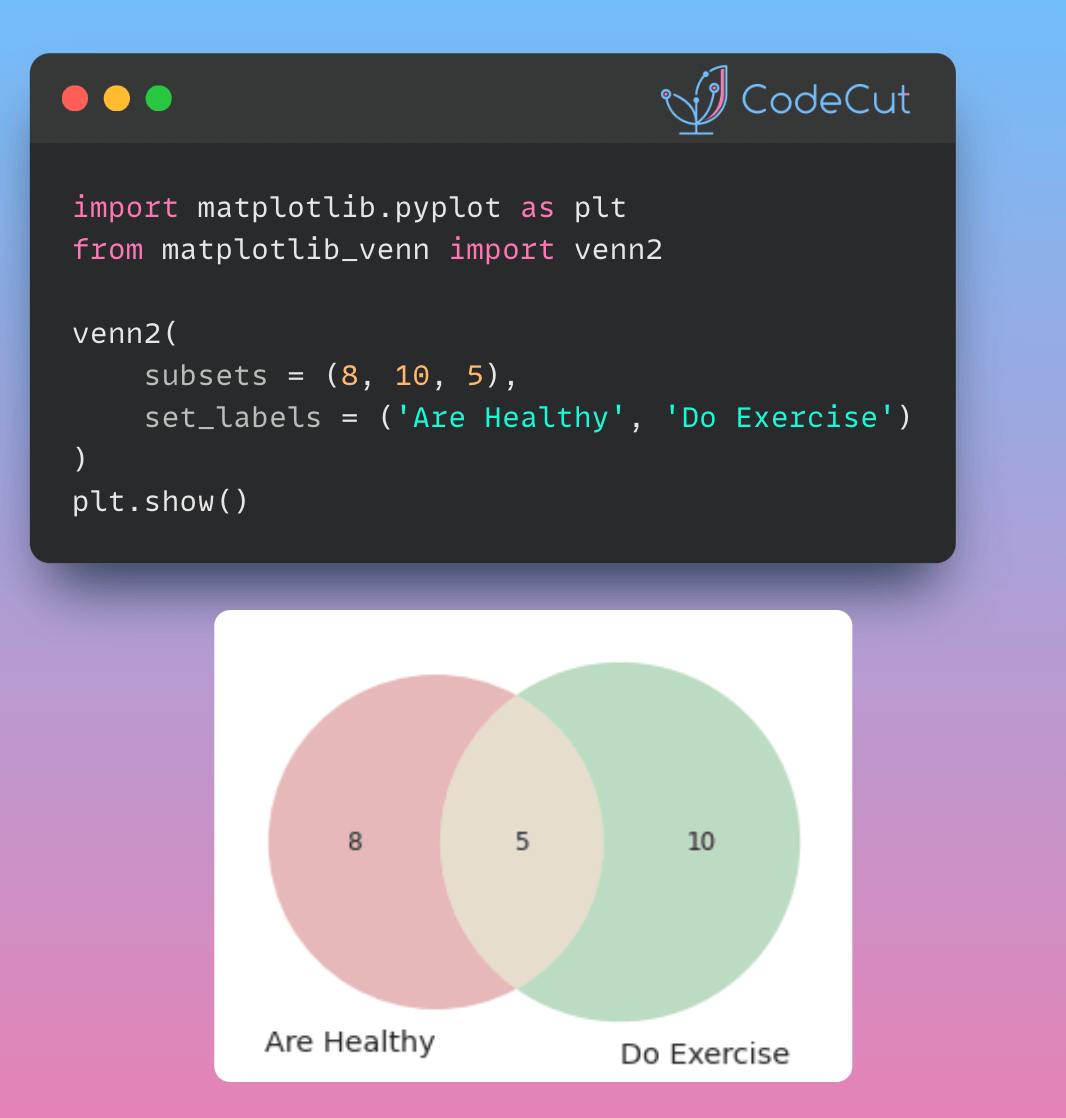
import matplotlib.pyplot as plt
from matplotlib_venn import venn2

venn2(subsets = (8, 10, 5), set_labels = ('Are Healthy', 'Do Exercise'))
plt.show()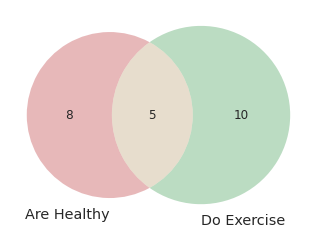
This code will create a Venn diagram with two circles, where the first circle represents people who are healthy, the second circle represents people who do exercise, and the overlap between the two circles represents people who are both healthy and do exercise.
Specifying Elements in Each Set
Instead of specifying the size of each region, you can also specify the elements in each set using the venn2 function. Here’s an example:
venn2([set(['A', 'B', 'C', 'D']), set(['D', 'E', 'F'])], set_labels=['Group1', 'Group2'])
plt.show()
This code creates a Venn diagram with two circles, where the first circle represents Group1 and the second circle represents Group2. The elements in each set are specified using the set function.
Creating a Venn Diagram with Three Circles
To create a Venn diagram with three circles, you can use the venn3 function from matplotlib-venn. This function takes three main arguments: subsets, set_labels, and colors. The subsets argument specifies the size of each region in the Venn diagram, while the set_labels argument specifies the labels for each set.
Here’s an example of how to create a Venn diagram with three circles:
from matplotlib_venn import venn3
venn3(subsets = (5, 5, 3, 5, 3, 3, 2), set_labels = ('Are Healthy', 'Do Exercise', 'Eat Well'))
plt.show()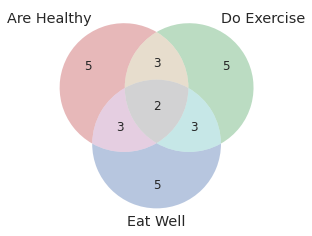
This code creates a Venn diagram with three circles, where the first circle represents people who are healthy, the second circle represents people who do exercise, and the third circle represents people who eat well.
Read Next
Trying to quickly make your data look presentable? Read our deep dive: Great Tables: Publication-Ready Tables from Polars and Pandas DataFrames. Create polished tables that match your publication-quality charts.