🤝 COLLABORATION
Data Contracts: Developing Production Grade Pipelines at Scale
Poor data quality can cause major problems for data teams, from disrupting pipelines to losing consumer trust. Many teams struggle with this, especially when data comes from upstream workflows outside their control.
The solution: data contracts. They document expectations, establish ownership, and enforce constraints within CI/CD workflows.
This practical book introduces data contract architecture, explains why the industry needs it, and shares real-world production use cases. You’ll learn to implement components and build a case for adoption in your organization.
→ Try Chapter 7 in your browser
📅 Today’s Picks
Build Visual Tables with Great Tables Nanoplots
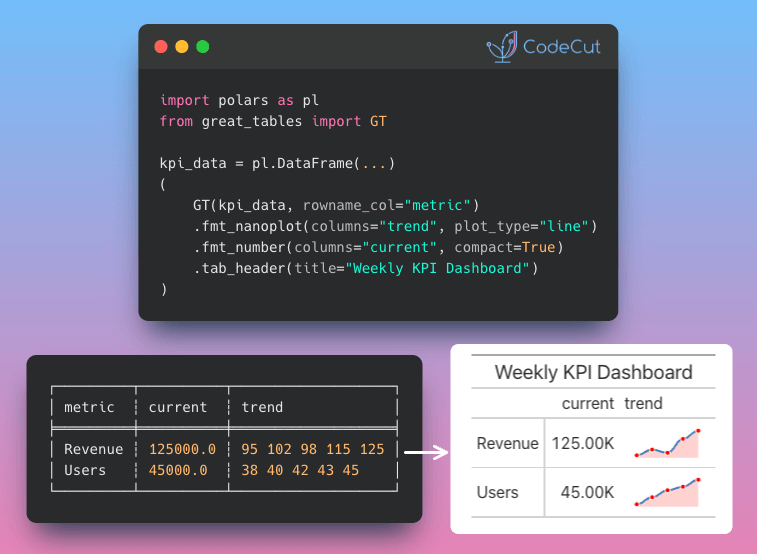
Problem
Data tables with raw numbers lack visual context.
You can’t spot trends or patterns at a glance when looking at columns of digits.
Solution
Great Tables’ fmt_nanoplot() embeds mini line or bar charts directly into table cells.
Key features:
- Transform numeric series into scannable visualizations
- Customize colors and styles for data points and lines
- Switch between line plots and bar charts
- Add data area shading for emphasis
☕️ Weekly Finds
TabPFN [ML] – Foundation model for tabular data with zero-shot classification and regression capabilities
scikit-survival [ML] – Survival analysis built on top of scikit-learn for time-to-event prediction
dedupe [Data Processing] – Python library for fuzzy matching, record deduplication and entity resolution using machine learning
Looking for a specific tool? Explore 70+ Python tools →
Stay Current with CodeCut
Actionable Python tips, curated for busy data pros. Skim in under 2 minutes, three times a week.