Motivation
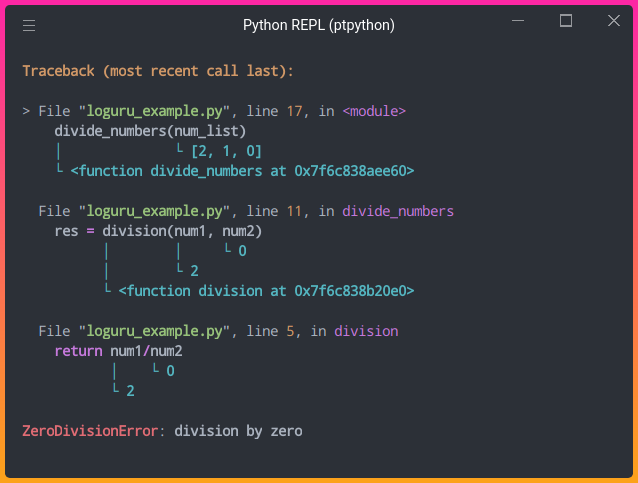
Have you ever seen an error output like below:
2 divided by 1 is equal to 2.0.
Traceback (most recent call last):
  File "loguru_example.py", line 17, in <module>
    divide_numbers(num_list)
  File "loguru_example.py", line 11, in divide_numbers
    res = division(num1, num2)
  File "loguru_example.py", line 5, in division
    return num1/num2
ZeroDivisionError: division by zero
And wish the output was easier to understand as shown here?

This article will introduce you to three tools that can help you simplify error messages and visualize code execution:
- Loguru — print better exceptions
- snoop — print the lines of code being executed in a function
- heartrate — visualize the execution of a Python program in real-time
And all it takes to use these tools is one line of code!
Loguru – Simplifying Error Messages
Loguru is a library that aims to make logging in Python more enjoyable. One of its most helpful features is the ability to catch unexpected errors and display the values of variables that cause your code to fail.
To install Loguru, type
pip install loguruTo understand how Loguru can be useful, imagine that you have 2 functions division and divide_numbersand the function divide_numbers is executed.
from itertools import combinations

def division(num1: int, num2: int):
    return num1/num2

def divide_numbers(num_list: list):
  """Division of 2 numbers in the number list """

    for comb in combinations(num_list, 2):
        num1, num2 = comb
        res = division(num1, num2)
        print(f"{num1} divided by {num2} is equal to {res}.")


if __name__ =='__main__':
    num_list = [2, 1, 0]
    divide_numbers(num_list)
After running the code above, we get this error:
2 divided by 1 is equal to 2.0.
Traceback (most recent call last):
  File "loguru_example.py", line 17, in <module>
    divide_numbers(num_list)
  File "loguru_example.py", line 11, in divide_numbers
    res = division(num1, num2)
  File "loguru_example.py", line 5, in division
    return num1/num2
ZeroDivisionError: division by zero
From the output, we know that the line return num1/num2 is where the error occurs, but we don’t know which values of num1 and num2 cause the error. Luckily, this can be easily tracked by adding Loguru’s logger.catch decorator:
from loguru import logger
from itertools import combinations

def division(num1: int, num2: int):
    return num1/num2

@logger.catch # Add this to track errors
def divide_numbers(num_list: list):
    for comb in combinations(num_list, 2):
        num1, num2 = comb
        res = division(num1, num2)
        print(f"{num1} divided by {num2} is equal to {res}.")


if __name__ =='__main__':
    num_list = [2, 1, 0]
    divide_numbers(num_list)
Output:

By adding logger.catch, the exceptions are much easier to understand! It turns out that the error occurs when dividing 2 by 0.
Snoop – Printing Lines of Code Being Executed
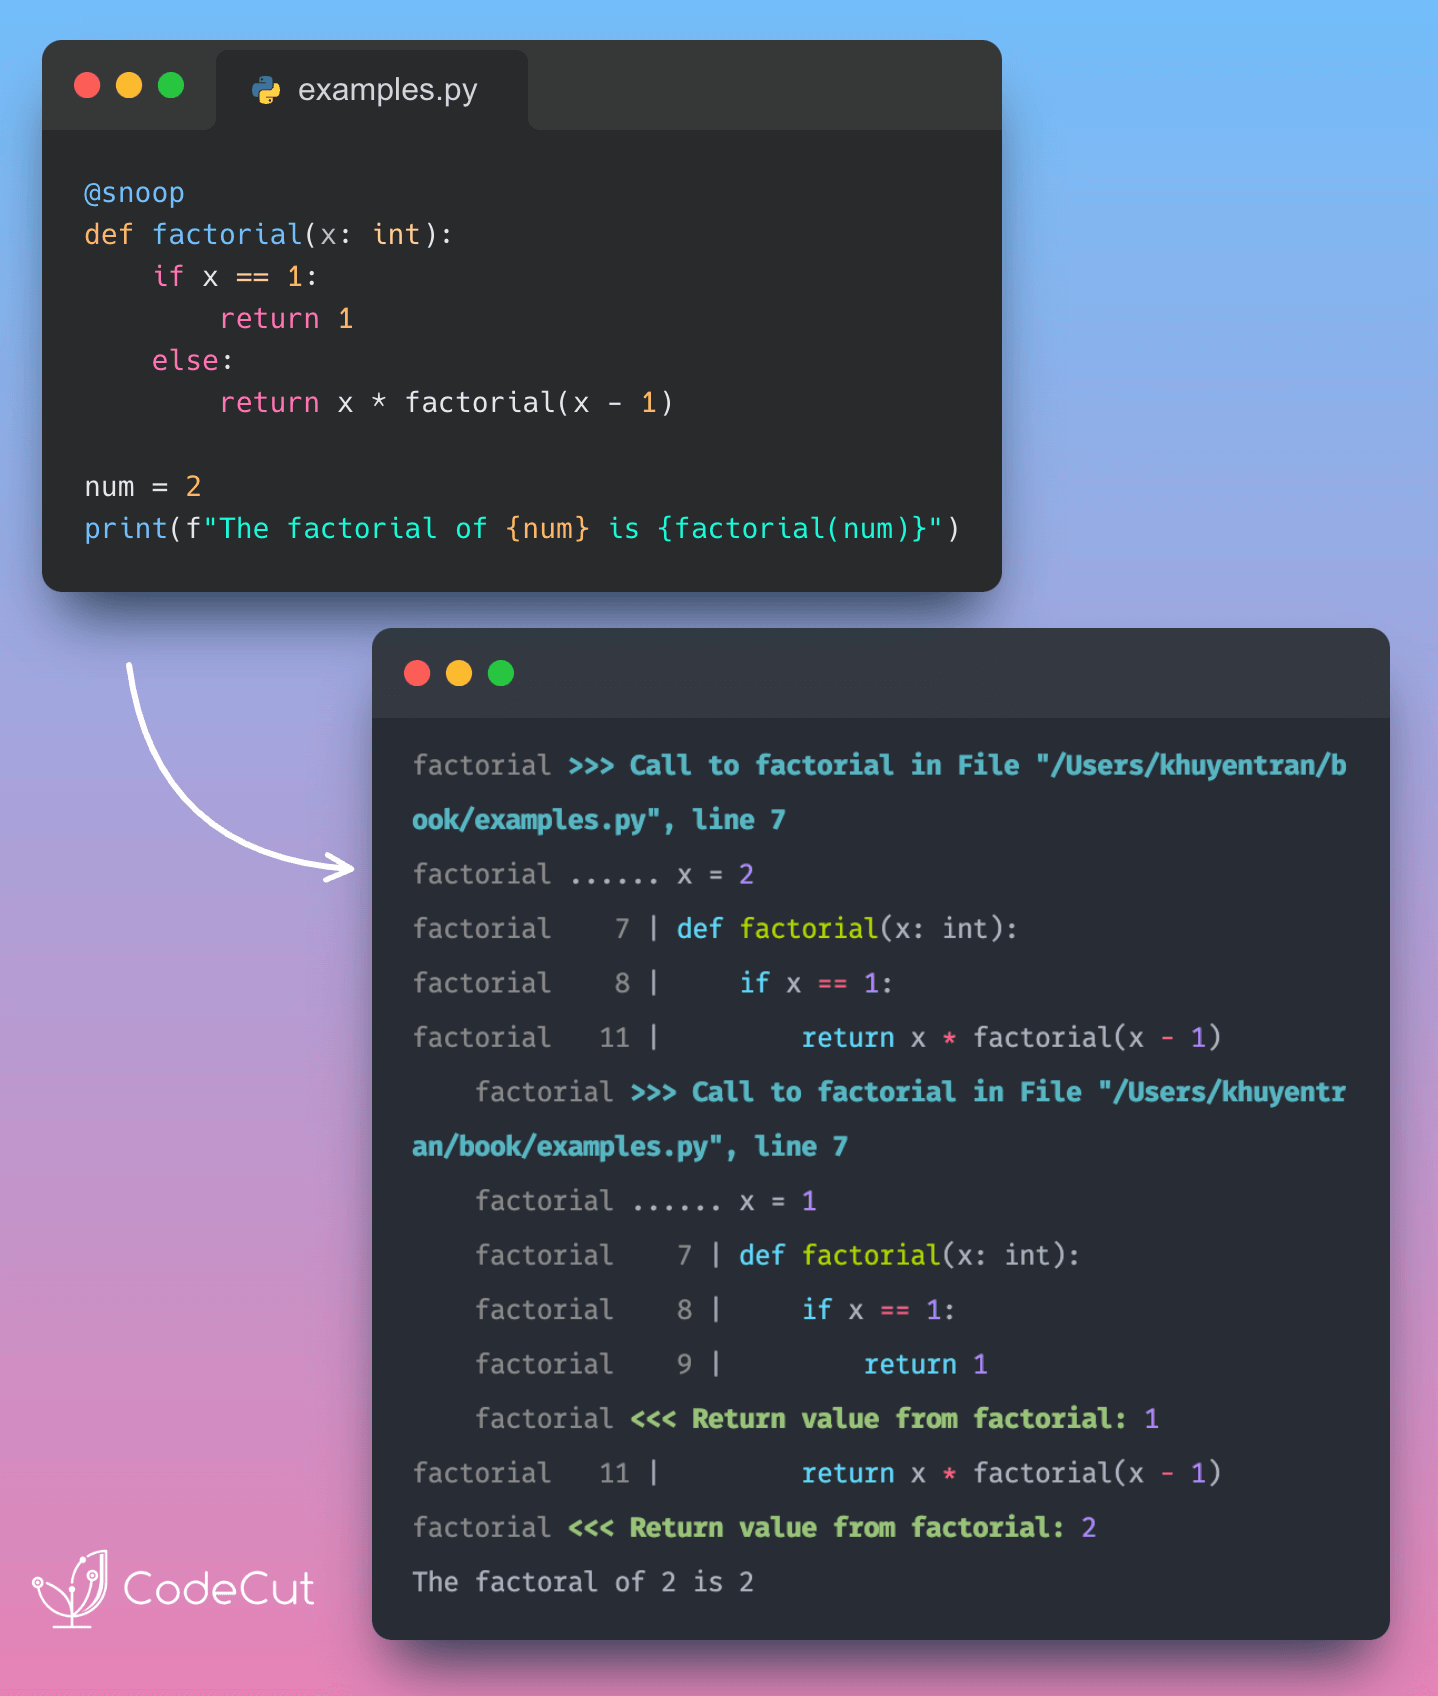
Snoop is a Python package that prints the lines of code being executed along with the values of each variable. It helps you understand what’s going on in your code.
To install Snoop, type:
pip install snoopLet’s imagine we have a function called factorial that finds the factorial of an integer.
import snoop

def factorial(x: int):
    if x == 1:
        return 1
    else:
        return (x * factorial(x-1))

if __name__ == "__main__":
    num = 5
    print(f"The factorial of {num} is {factorial(num)}")
Output:
The factorial of 5 is 120To understand why the output of factorial(5) is 20 , we can add snoop decorator to the function factorial .
import snoop

@snoop
def factorial(x):
    if x == 1:
        return 1
    else:
        return (x * factorial(x-1))


if __name__ == "__main__":
    num = 5
    print(f"The factorial of {num} is {factorial(num)}")
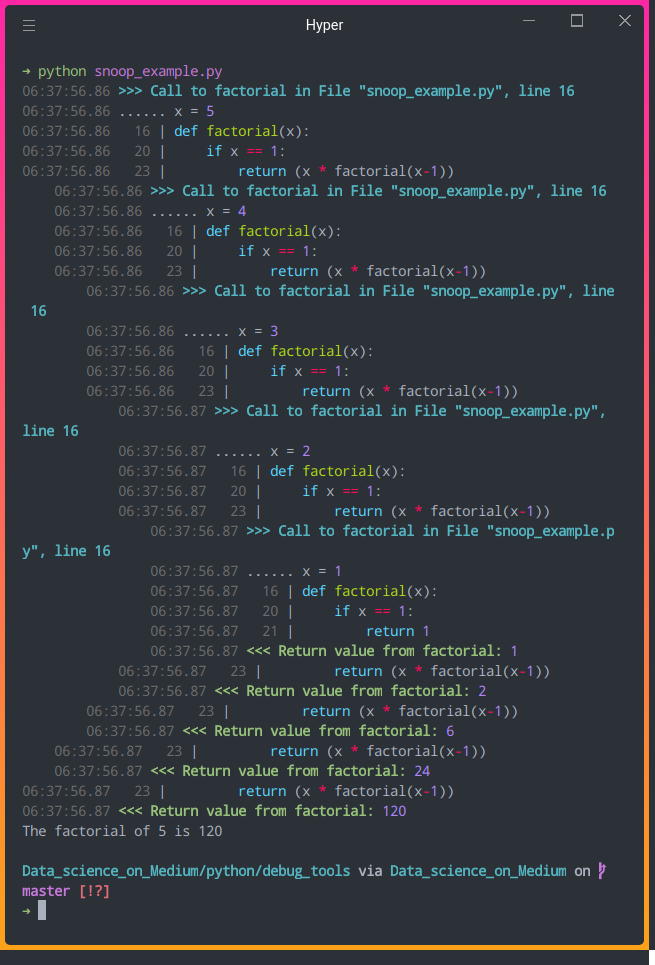
Output:

In the output above, we can view the values of the variables and which lines of code are executed. Now we can understand how recursion works much better!
Heartrate – Visualizing Code Execution in Real-Time
Heartrate is a tool that visualizes the execution of a Python program in real-time. It shows which lines of code are being executed and how many times they are executed.
To install Heartrate, type:
pip install heartrateNow let’s add heartrate.trace(browser=True) to our previous code. This will open a browser window displaying the visualization of the file where trace() was called.
import heartrate
heartrate.trace(browser=True)

def factorial(x):
    if x == 1:
        return 1
    else:
        return (x * factorial(x-1))


if __name__ == "__main__":
    num = 5
    print(f"The factorial of {num} is {factorial(num)}")
A new browser window will pop up when you run the code above. If not, go to http://localhost:9999. You should see the output like below:

The bars show the lines that have been hit. The longer bars mean more hits, lighter colors mean more recent.
From the output above, we can see that the program executes:
if x==15 timesreturn 1oncereturn (x * factorial(x-1))4 times
The output makes sense since the initial value of x is 5 and the function is called repetitively until x equals to 1 .
Now let’s see what it is like to visualize the execution of a Python program in real-time using heartrate. To make the visualization more apparent, we’ll add a short delay to the program using sleep(0.5) and increase the value of num to 20.

Awesome! We can see which lines of code are being executed and how many times each of them has been executed in real-time.
Conclusion
You have just learned 3 tools to track and visualize the execution of your Python code. I hope debugging will be less painful for you when using these 3 tools. Since these tools only require one line of code, why not give them a try to see how helpful they are?


