
Quadratic: Where Spreadsheets Meet Python and SQL
If you want to use Python or SQL in an Excel sheet, use quadratic.
Quadratic: Where Spreadsheets Meet Python and SQL Read More »
If you want to use Python or SQL in an Excel sheet, use quadratic.
Quadratic: Where Spreadsheets Meet Python and SQL Read More »

Comparing outcomes across different scenarios is essential for decision-making and strategic planning in various fields.
For example, by comparing sales predictions under various scenarios, retailers can more accurately forecast inventory needs, reducing the risk of overstocking.
Taipy, an open-source Python library, simplifies scenario creation and provides interactive UI components to visualize outcomes.
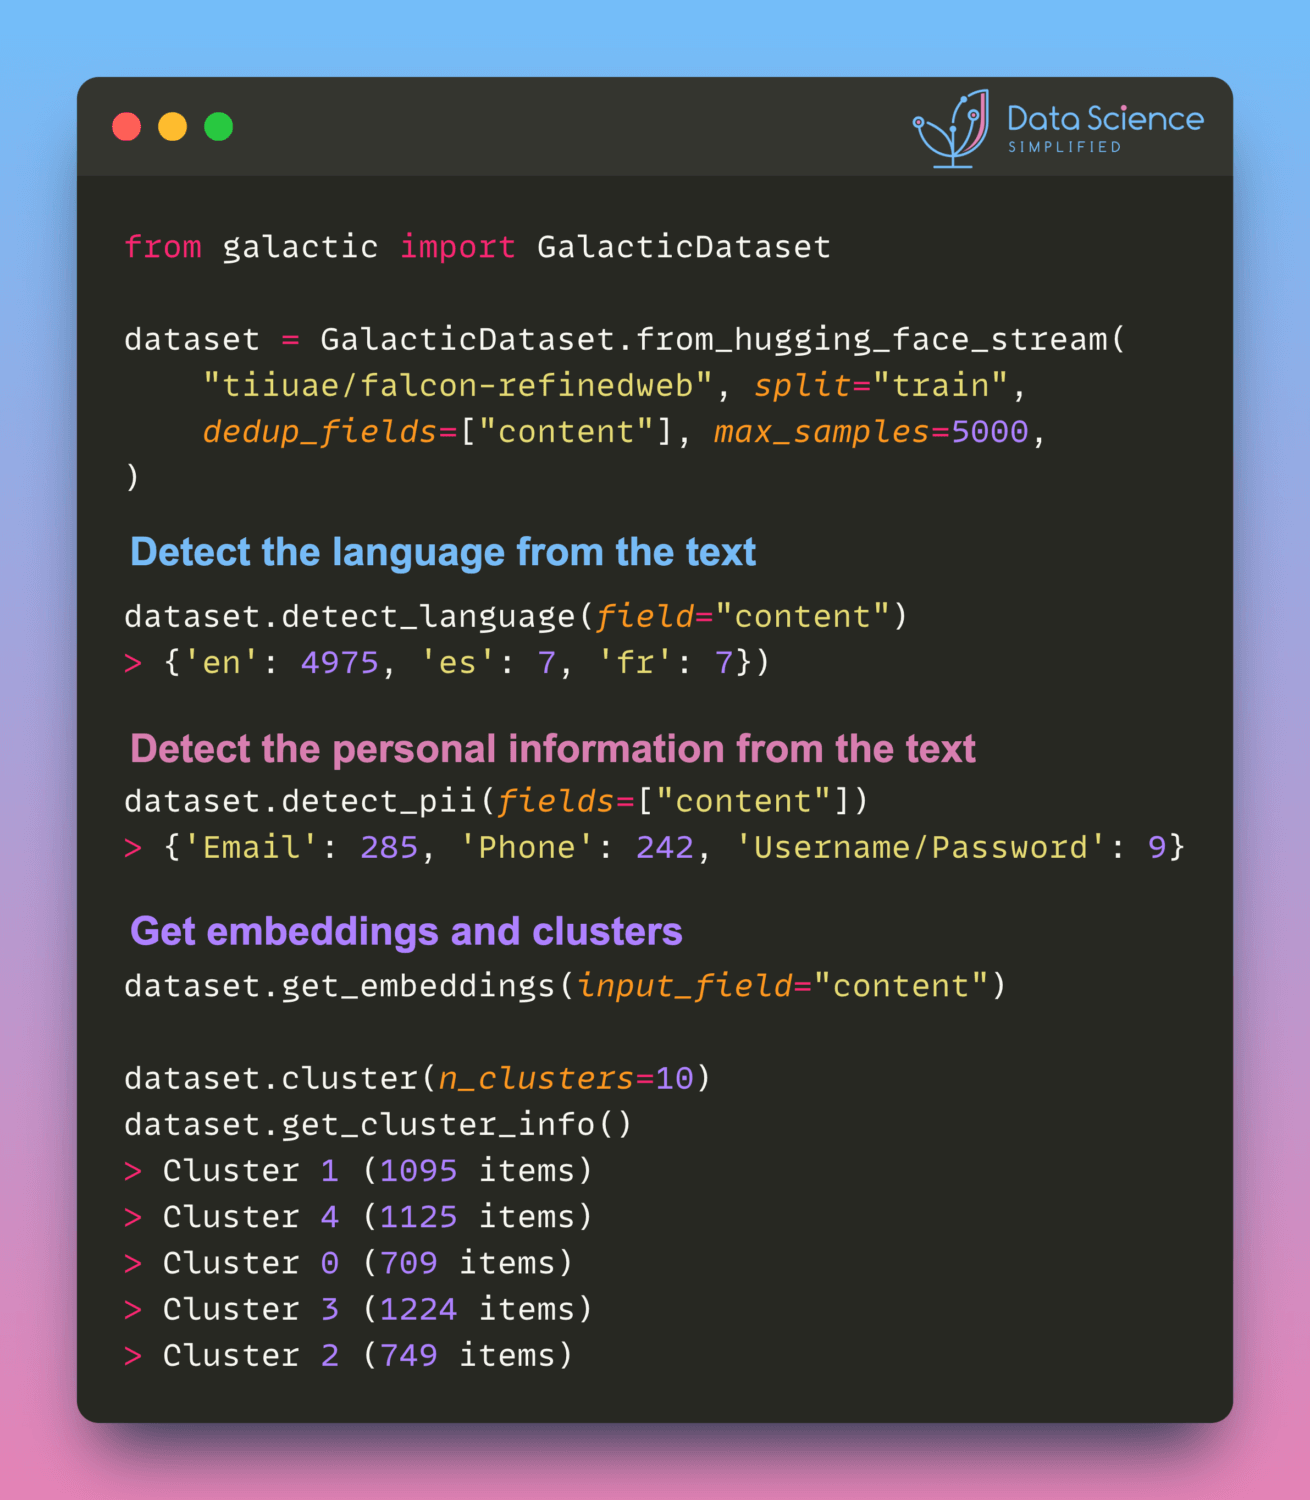
If you want to clean, gain insights, and create embeddings from massive unstructured text datasets, use Galatic.
Galatic: Clean and Analyze Massive Text Datasets Read More »
Have you ever wanted to quickly visualize, analyze, or manipulate your data by only clicking and selecting? Dtale allows you to do all of the above seamlessly within your Jupyter Notebook kernel.
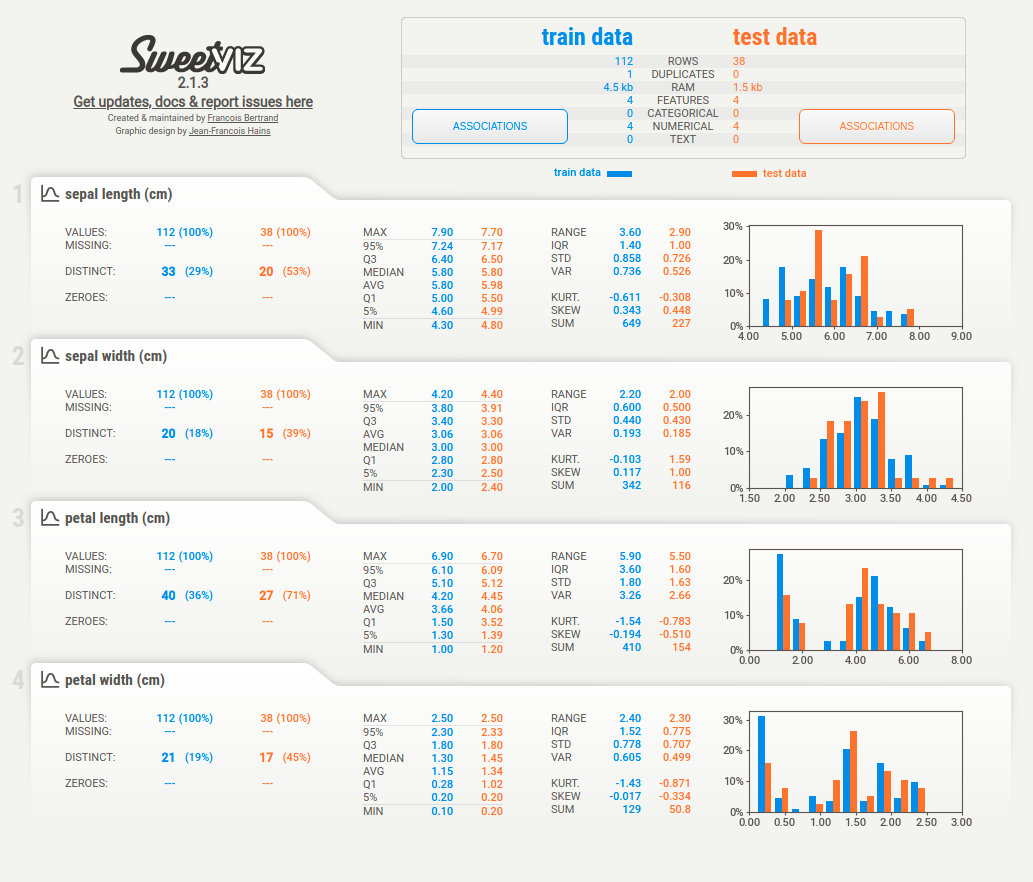
For a quick comparison of stats (missing, distinct, mean) between train and test sets in Python, use sweetviz.
Sweetviz: Compare the Similar Features Between 2 Different Datasets Read More »

To quickly analyze your pandas DataFrame in a few simple clicks directly in your Jupyter Notebook, try dtale.
Effortless DataFrame Analysis in Jupyter Notebook with dtale Read More »
Have you ever taken a while to come up with the visualizations for your data? With Lux, you can get some suggestions on what to visualize.
To use Lux, simply import it.
Lux: A Python API for Intelligent Visual Discovery Read More »
If you want to explore and edit your tabular data on the terminal, use VisiData.
VisiData supports tsv, csv, sqlite, json, xlsx (Excel), hdf5, and many other formats.
VisiData: A terminal interface for exploring and arranging tabular data Read More »
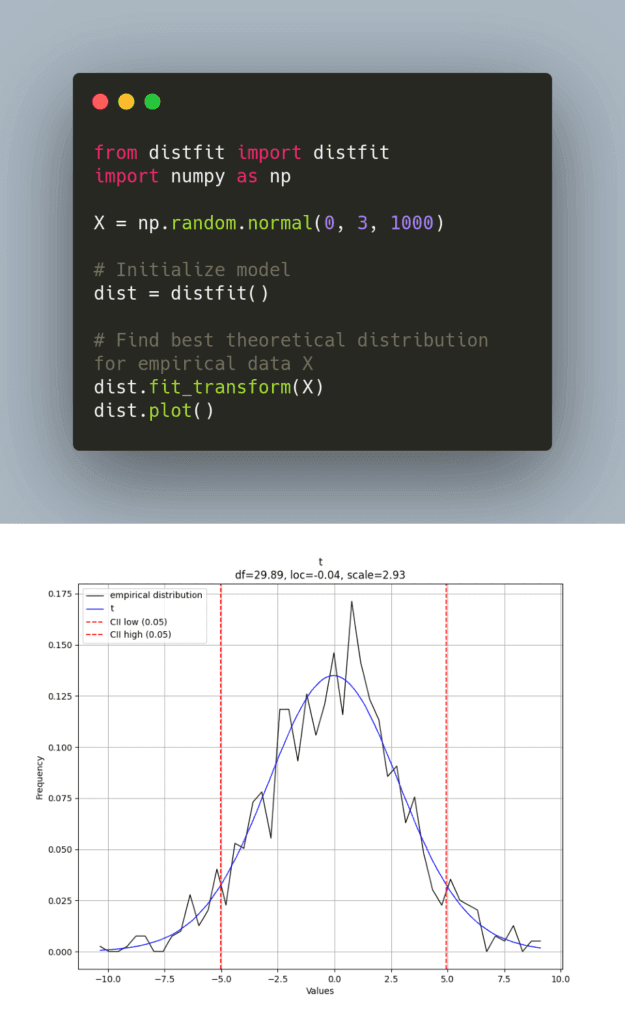
If you want to find the best theoretical distribution for your data in Python, try distfit. The code above shows the output of distfit.
Besides finding the best theoretical distribution, distfit is also useful in detecting outliers. New data points that deviate significantly can then be marked as outliers.
Link to distfit.
Link to the source code.
distfit: Find The Best Theoretical Distribution For Your Data in Python Read More »
Have you ever wanted to explore a dataset in a browser or publish your dataset so that others can explore and download your data? If so, try Datasette.
Above is how the website for your data will look like after publishing it with Datasette.
In my latest article, you will learn how to use Datasette to explore your dataset in a browser and publish it as a website with Heroku.
Link to the article.
Explore the FiveThirtyEight’s Hate Crimes dataset using Datasette.
Datasette: Explore and Publish Your Data in One Line of Code Read More »