Evaluating trading strategies’ effectiveness is crucial for financial decision-making, but it’s challenging due to the complexities of historical data analysis and strategy testing.
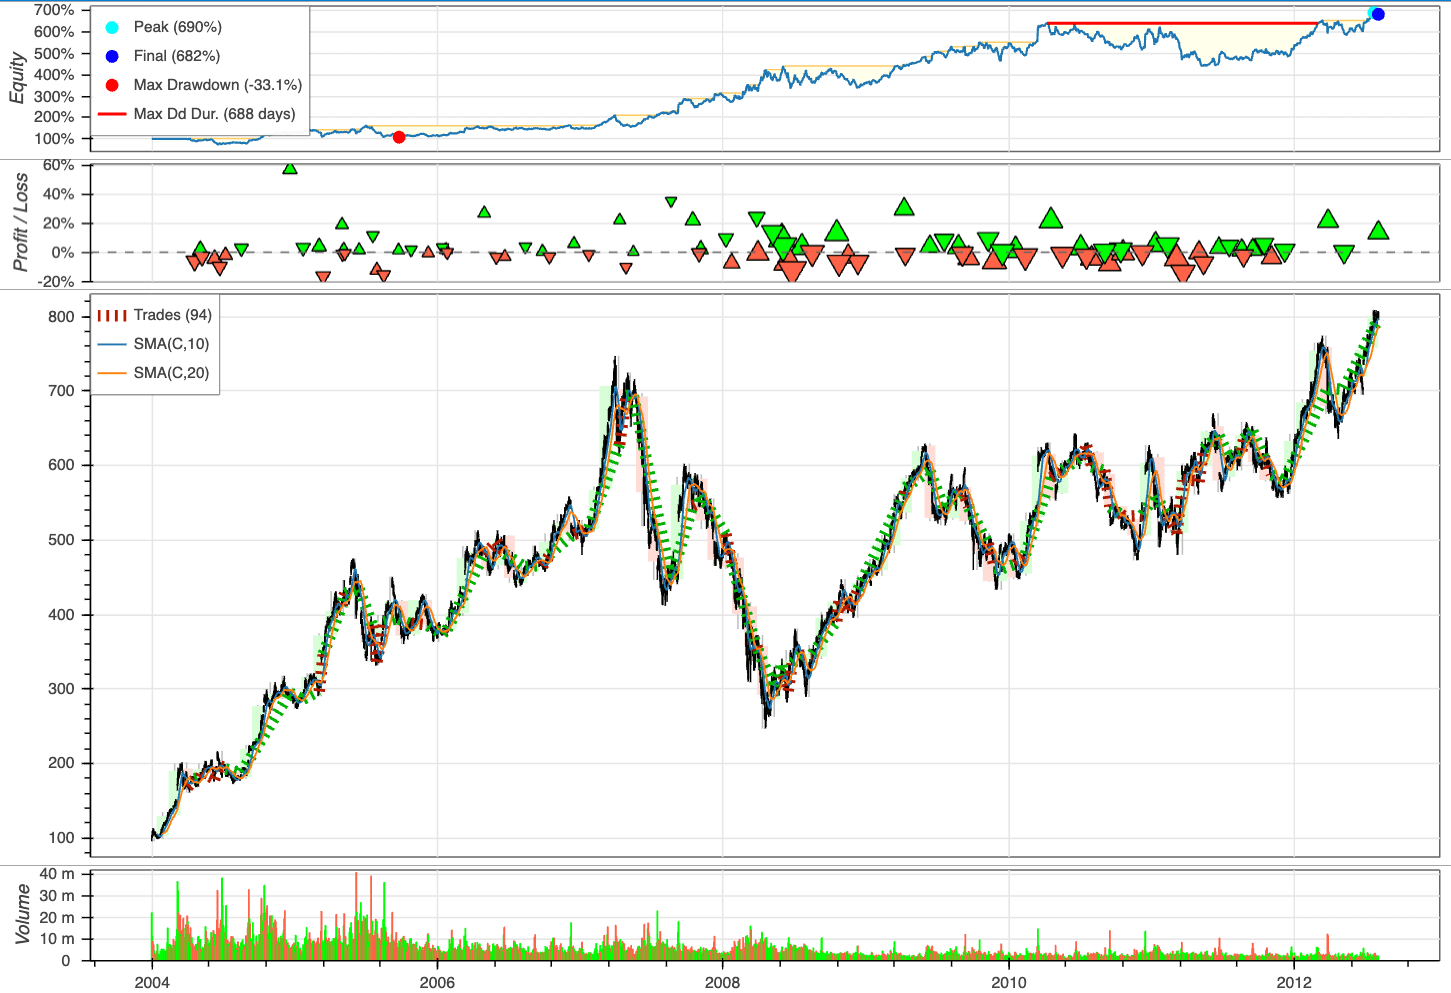
Backtesting allows users to simulate trades based on historical data and visualize the outcomes through interactive plots in three lines of code.
To see how Backtesting works, let’s create our first strategy to backtest on these Google data, a simple moving average (MA) cross-over strategy.
from backtesting.test import GOOG

GOOG.tail()
Open High Low Close Volume
2013-02-25 802.3 808.41 790.49 790.77 2303900
2013-02-26 795.0 795.95 784.40 790.13 2202500
2013-02-27 794.8 804.75 791.11 799.78 2026100
2013-02-28 801.1 806.99 801.03 801.20 2265800
2013-03-01 797.8 807.14 796.15 806.19 2175400import pandas as pd
def SMA(values, n):
"""
Return simple moving average of `values`, at
each step taking into account `n` previous values.
"""
return pd.Series(values).rolling(n).mean()from backtesting import Strategy
from backtesting.lib import crossover
class SmaCross(Strategy):
# Define the two MA lags as *class variables*
# for later optimization
n1 = 10
n2 = 20
def init(self):
# Precompute the two moving averages
self.sma1 = self.I(SMA, self.data.Close, self.n1)
self.sma2 = self.I(SMA, self.data.Close, self.n2)
def next(self):
# If sma1 crosses above sma2, close any existing
# short trades, and buy the asset
if crossover(self.sma1, self.sma2):
self.position.close()
self.buy()
# Else, if sma1 crosses below sma2, close any existing
# long trades, and sell the asset
elif crossover(self.sma2, self.sma1):
self.position.close()
self.sell()To assess the performance of our investment strategy, we will instantiate a Backtest object, using Google stock data as our asset of interest and incorporating the SmaCross strategy class. We’ll start with an initial cash balance of 10,000 units and set the broker’s commission to a realistic rate of 0.2%.
from backtesting import Backtest

bt = Backtest(GOOG, SmaCross, cash=10_000, commission=.002)
stats = bt.run()
stats
Start 2004-08-19 00:00:00
End 2013-03-01 00:00:00
Duration 3116 days 00:00:00
Exposure Time [%] 97.067039
Equity Final [$] 68221.96986
Equity Peak [$] 68991.21986
Return [%] 582.219699
Buy & Hold Return [%] 703.458242
Return (Ann.) [%] 25.266427
Volatility (Ann.) [%] 38.383008
Sharpe Ratio 0.658271
Sortino Ratio 1.288779
Calmar Ratio 0.763748
Max. Drawdown [%] -33.082172
Avg. Drawdown [%] -5.581506
Max. Drawdown Duration 688 days 00:00:00
Avg. Drawdown Duration 41 days 00:00:00
# Trades 94
Win Rate [%] 54.255319
Best Trade [%] 57.11931
Worst Trade [%] -16.629898
Avg. Trade [%] 2.074326
Max. Trade Duration 121 days 00:00:00
Avg. Trade Duration 33 days 00:00:00
Profit Factor 2.190805
Expectancy [%] 2.606294
SQN 1.990216
_strategy SmaCross
_equity_curve ...
_trades Size EntryB...
dtype: objectPlot the outcomes:
bt.plot()