Having multiple function parameters can make code hard to maintain and prone to errors. In this article, we will explore how to simplify function parameters using dataclasses.
What are Dataclasses?
Dataclasses are a simple way to create classes that primarily hold data. They provide a simple syntax for creating classes, making them ideal for grouping related data into simple data structures.
The Problem: Multiple Function Parameters
We will start by creating two different datasets.
import numpy as np
import matplotlib.pyplot as plt

# Generate sample time series data
np.random.seed(42)

# Dataset 1: Stock-like price movements
n_points = 100
trend1 = np.linspace(100, 150, n_points)
noise1 = np.cumsum(np.random.normal(0, 1, n_points))
stock_prices = trend1 + noise1

# Dataset 2: Seasonal pattern with noise
t = np.linspace(0, 4*np.pi, n_points)
seasonal_data = 10 * np.sin(t) + np.random.normal(0, 1, n_points)
Now, let’s define the plot_time_series function using many arguments.
def plot_time_series(
    data,
    x_label: str,
    y_label: str,
    title: str,
    line_color: str = "blue",
    line_width: float = 1.5,
    marker: str = "o",
    marker_size: int = 6,
    grid: bool = True,
):
    plt.style.use("dark_background")
    plt.plot(
        data,
        color=line_color,
        linewidth=line_width,
        marker=marker,
        markersize=marker_size,
    )
    plt.xlabel(x_label)
    plt.ylabel(y_label)
    plt.title(title)
    if grid:
        plt.grid(True)
    plt.show()
Reusing this function for different datasets requires passing the same arguments for the line color, line width, marker, marker size, and grid for both datasets, which can be error-prone and difficult to maintain.
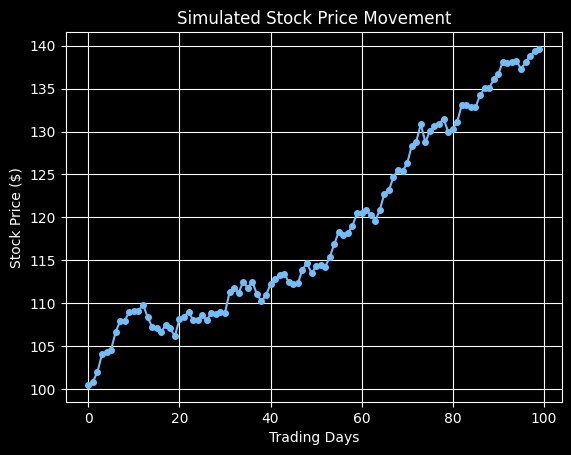
plot_time_series(
    data=stock_prices,
    x_label="Trading Days",
    y_label="Stock Price ($)",
    title="Simulated Stock Price Movement",
    line_color="#72BEFA",
    line_width=1.5,
    marker=".",
    marker_size=8,
    grid=True,
)
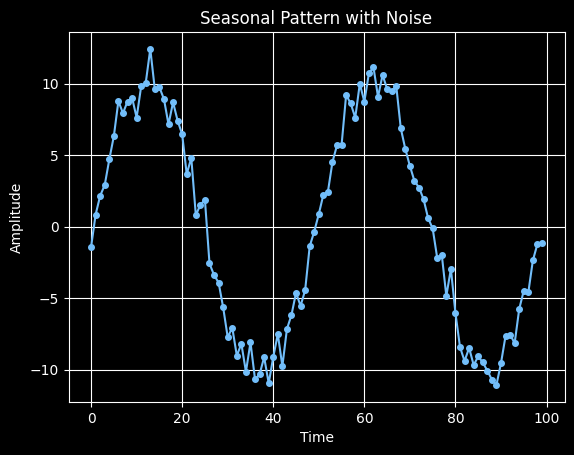
plot_time_series(
    data=seasonal_data,
    x_label="Time",
    y_label="Amplitude",
    title="Seasonal Pattern with Noise",
    line_color="#72BEFA",
    line_width=1.5,
    marker=".",
    marker_size=8,
    grid=True,
)
The Solution: Dataclasses
With Dataclasses, we can group styling parameters into a PlotStyle dataclass.
from dataclasses import dataclass

@dataclass
class PlotStyle:
    line_color: str = "#72BEFA"
    line_width: float = 1.5
    marker: str = "."
    marker_size: int = 8
    grid: bool = True
Then modify the plot_time_series function to accept a PlotStyle object.
def plot_time_series(
    data, x_label: str, y_label: str, title: str, style: PlotStyle = PlotStyle()
):
    plt.plot(
        data,
        color=style.line_color,
        linewidth=style.line_width,
        marker=style.marker,
        markersize=style.marker_size,
    )
    plt.xlabel(x_label)
    plt.ylabel(y_label)
    plt.title(title)
    if style.grid:
        plt.grid(True)
    plt.show()
Now we can create a custom style once and reuse it for multiple plots.
custom_style = PlotStyle(line_color="#E583B6", marker=".", marker_size=8)

plot_time_series(stock_prices, "Time", "Value 1", "Plot 1", custom_style)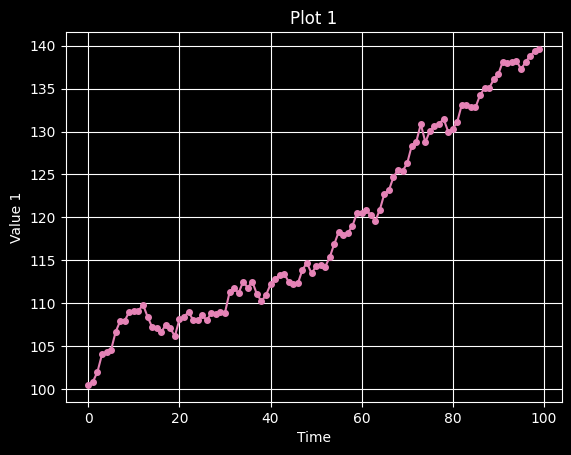
plot_time_series(seasonal_data, "Time", "Value 2", "Plot 2", custom_style)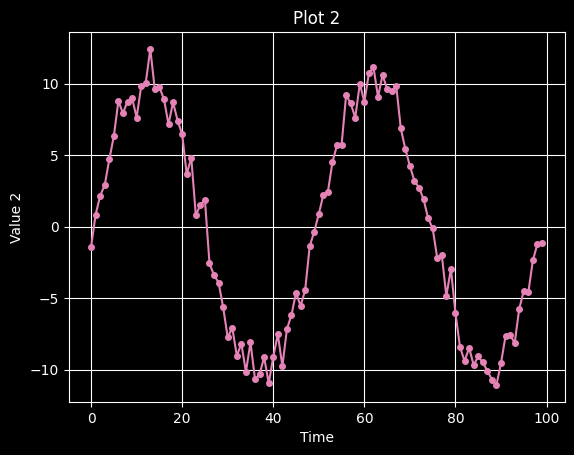
By using dataclasses, we can avoid passing multiple arguments to the function and make the code more maintainable.