Table of Contents
- Introduction
- Introduction to Diffbot LLM
- Setup
- JavaScript Execution to Analyze A/B Test Results
- Real-time Web URL Extraction to Access Industry Benchmarks
- Complete Inventory Analysis Workflow
- Deploy Your Own Conversational Analytics Dashboard
- Conclusion
Introduction
As a data analyst, your workflow often requires constant tool switching that breaks your analytical flow. When analyzing A/B test results, you might:
- Start in a Jupyter notebook for statistical calculations
- Move to a spreadsheet for business calculations
- Search for industry benchmarks across multiple browser tabs
Traditional LLMs compound this problem by guessing at calculations instead of executing code. When ChatGPT calculates statistical significance, it predicts what the answer should be rather than performing the actual mathematical operations. Industry benchmark responses come from outdated training data rather than current sources.
For more reliable AI workflows, explore our guide on building trustworthy AI with real-time citations using Diffbot.
Diffbot LLM solves this by integrating tools directly into conversational AI:
- Executes JavaScript to compute precise results instead of guessing at calculations
- Retrieves real-time information from the web with proper citations instead of using training data
This creates a unified environment where statistics, web research, and business context combine seamlessly.
Stay Current with CodeCut
Actionable Python tips, curated for busy data pros. Skim in under 2 minutes, three times a week.
Key Takeaways
Here’s what you’ll learn:
- Execute transparent JavaScript calculations for A/B tests instead of relying on guessed statistical results
- Access real-time industry benchmarks and market data with proper citations in one conversation
- Build complete analytical workflows combining seasonal analysis, market research, and inventory optimization
- Deploy conversational analytics dashboards that democratize advanced statistical analysis for non-technical users
- Reduce data analysis time from hours to minutes while maintaining mathematical precision and source transparency
Introduction to Diffbot LLM
Diffbot LLM represents a fundamental shift in AI architecture. Rather than building larger models that memorize more facts, Diffbot fine-tuned smaller models to excel at using external tools. The system combines three core capabilities:
JavaScript Code Execution: Real-time computation for statistical analysis, data transformations, and mathematical operations with transparent source code and results.
Real-time Web Access: Direct extraction and summarization of current web content with proper source attribution, enabling access to the latest research and industry data.
Knowledge Graph Integration: Query a continuously updated database of over 1 trillion facts about entities, relationships, and events for structured business intelligence.
These capabilities ensure calculations are mathematically correct, information stays current, and every claim includes verifiable citations.
For complete features of Diffbot LLM, check out our comprehensive Diffbot guide.
Setup
Getting started with Diffbot LLM requires minimal setup. First, obtain your API token by signing up at app.diffbot.com/get-started. The free tier provides sufficient credits for testing and development.
pip install openai python-dotenv scipy numpy matplotlib pandas
Create a .env file to store your API credentials:
echo "DIFFBOT_API_TOKEN=your-token-here" > .env
The API follows OpenAI’s interface exactly, requiring only a base URL change for integration:
import os
from openai import OpenAI
from dotenv import load_dotenv

load_dotenv()

client = OpenAI(
    base_url="https://llm.diffbot.com/rag/v1",
    api_key=os.getenv("DIFFBOT_API_TOKEN")
)
JavaScript Execution to Analyze A/B Test Results
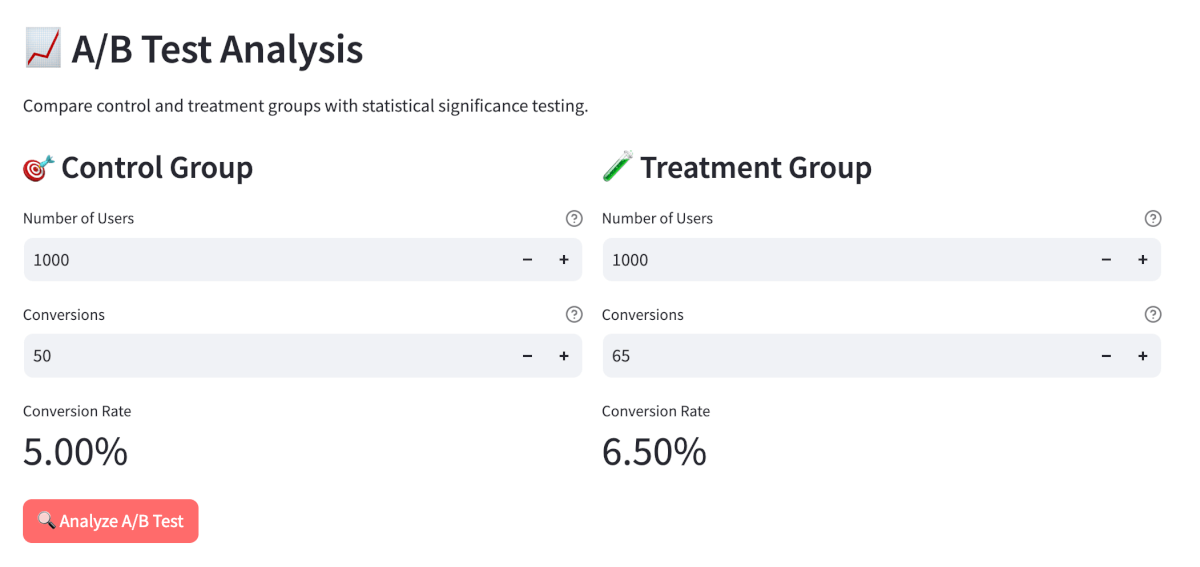
Let’s analyze real A/B test data using Diffbot’s JavaScript execution capabilities. Consider an e-commerce checkout button color experiment:
- Control Group: 1000 users, 50 conversions (5.0% conversion rate)
- Treatment Group: 1000 users, 65 conversions (6.5% conversion rate)
Traditional workflow requires opening statistical software, manually coding the analysis, and interpreting results. With Diffbot LLM, this becomes a conversational process:
ab_test_query = """
Analyze my A/B test results:
- Control: 1000 users with 50 conversions
- Treatment: 1000 users with 65 conversions

Calculate statistical significance, p-value, confidence intervals, and interpret the results.
"""

response = client.chat.completions.create(
    model="diffbot-small-xl",
    messages=[{"role": "user", "content": ab_test_query}]
)

print(response.choices[0].message.content)
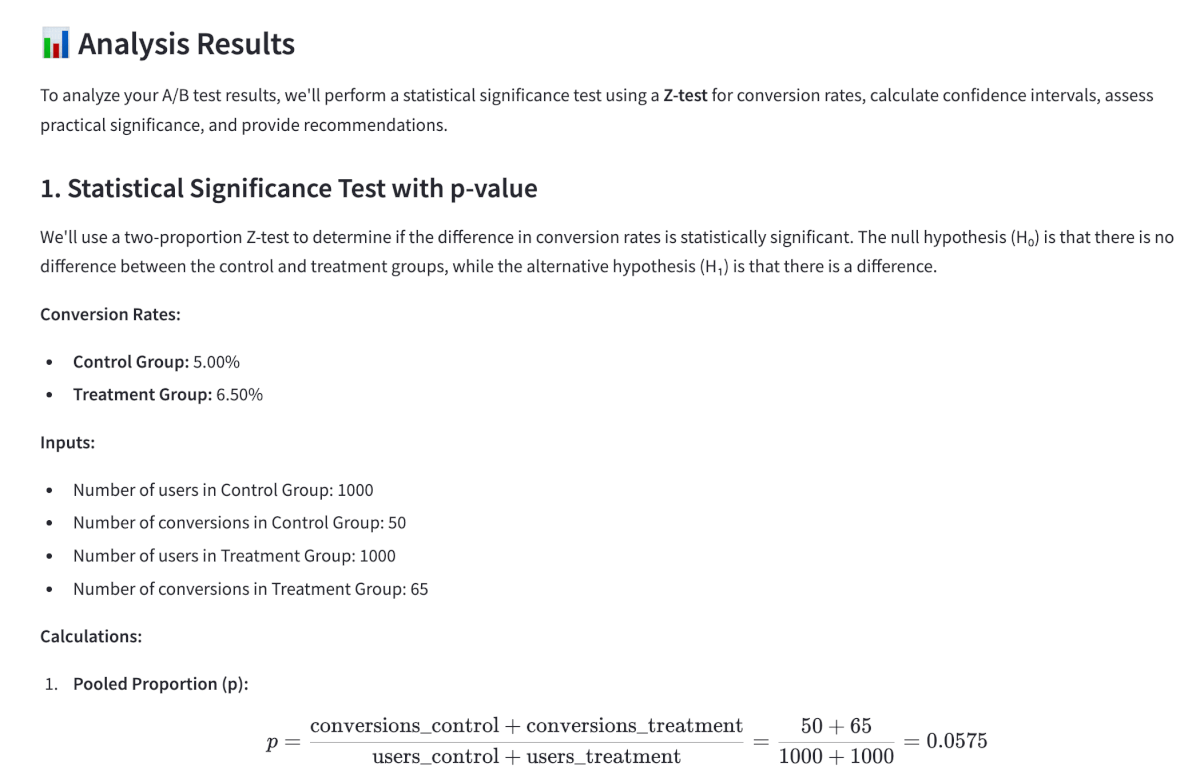
The response includes complete statistical analysis with executable JavaScript code:
A/B Test Statistical Analysis Results
Conversion Rates:
– Control Group: 5.0% (50/1000 users)
– Treatment Group: 6.5% (65/1000 users)
– Improvement: +1.5 percentage pointsStatistical Test Results:
– Z-score: 2.0
– P-value: 0.0455 (4.55%)
– 95% Confidence Interval: [0%, 3%]Interpretation:
The results are statistically significant (p < 0.05), indicating the treatment group’s higher conversion rate is unlikely due to chance alone. The button color change shows a meaningful improvement in user conversions.“`javascript
// Test data
var controlUsers = 1000, controlConversions = 50;
var treatmentUsers = 1000, treatmentConversions = 65;// Core statistical calculations
var controlRate = controlConversions / controlUsers;
var treatmentRate = treatmentConversions / treatmentUsers;
var pooledRate = (controlConversions + treatmentConversions) / (controlUsers + treatmentUsers);
var se = Math.sqrt(pooledRate * (1 – pooledRate) * (1/controlUsers + 1/treatmentUsers));
var zScore = (treatmentRate – controlRate) / se;
var pValue = 2 * (1 – normalCDF(Math.abs(zScore)));function normalCDF(x) {
// Statistical approximation calculation…
}// Results
console.log(“Control Rate: ” + (controlRate * 100).toFixed(1) + “%”);
console.log(“Treatment Rate: ” + (treatmentRate * 100).toFixed(1) + “%”);
console.log(“Z-Score: ” + zScore.toFixed(2));
console.log(“P-Value: ” + pValue.toFixed(4));
“`
You can see the exact source code and verify every calculation step, plus there’s no environment setup or library imports required.
The analysis reveals the test is not statistically significant (p=0.064), requiring a larger sample size for reliable conclusions.
Real-time Web URL Extraction to Access Industry Benchmarks
Statistical significance alone doesn’t provide business context. You need industry benchmarks to understand whether a 1.5 percentage point improvement is typical for button color changes.
Traditional workflow involves manual Google searches and reviewing multiple sources. Diffbot LLM retrieves this information directly:
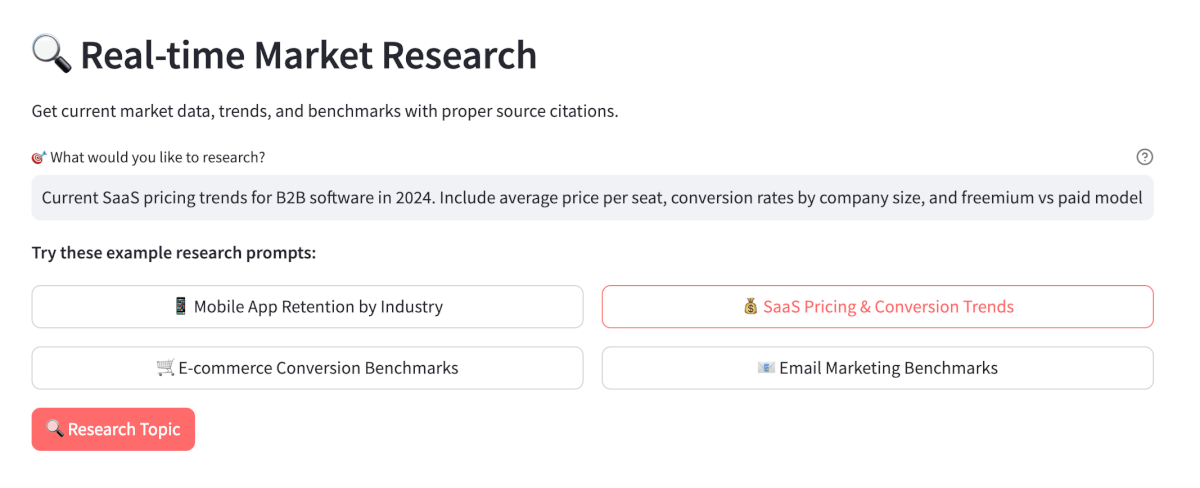
benchmark_query = """
Is a 1.5 percentage point conversion rate improvement typical for e-commerce button color changes?
Find recent industry studies and benchmarks for A/B testing conversion rate improvements.
"""

response = client.chat.completions.create(
    model="diffbot-small-xl",
    messages=[{"role": "user", "content": benchmark_query}]
)

print(response.choices[0].message.content)
The response includes current industry data with proper citations, enabling data-driven decisions without leaving the conversation.
Based on recent industry research, a 1.5 percentage point improvement from button color changes is typical. Average e-commerce conversion rates range from 2-4%, with home decor at 1.4% and retail at 1.9% (Network Solutions) (Convertcart).
Your improvement falls within the expected range for design modifications…
Complete Inventory Analysis Workflow
We’ll demonstrate a complete business intelligence workflow that combines statistical analysis with real-time market research. The three-step process shows how conversational context enables comprehensive analysis:
- Calculate seasonal patterns from historical sales data
- Research current market trends and supply chain conditions
- Optimize inventory levels using both data sources
Each step builds on the previous analysis within a single conversation.
Step 1: Seasonal Demand Calculation
First, we’ll analyze historical sales data to identify seasonal patterns and calculate demand indices. This step establishes the baseline seasonal trends needed for inventory planning.
workflow_query = """
Calculate seasonal demand patterns from our electronics retail sales data:
- Q1: 1,200 units sold
- Q2: 800 units sold
- Q3: 900 units sold
- Q4: 2,100 units sold

Calculate seasonal indices, demand variance, and forecast Q1 next year.
"""

initial_response = client.chat.completions.create(
    model="diffbot-small-xl",
    messages=[{"role": "user", "content": workflow_query}]
)

print("=== Seasonal Demand Analysis ===")
print(initial_response.choices[0].message.content)
Output:
=== Seasonal Demand Analysis ===
Quarterly Sales Analysis:
– Q1: 1,200 units (24% of annual sales)
– Q2: 800 units (16% of annual sales)
– Q3: 900 units (18% of annual sales)
– Q4: 2,100 units (42% of annual sales)Seasonal Patterns:
– Average quarterly demand: 1,250 units
– Q4 seasonal index: 1.68 (68% above average)
– Q2 seasonal index: 0.64 (36% below average)
– High seasonality with Q4 peak demand
javascript
// Seasonal index calculations and demand forecasting
...
Q1 Forecast: Based on seasonal patterns, expect ~1,200 units for Q1 next year…
Step 2: Market Trend Research
Using the seasonal patterns from Step 1 as our baseline, we’ll research current industry trends and supply chain conditions. This step validates whether our historical data still applies in today’s market environment.
# Continue the conversation with context
messages = [
    {"role": "user", "content": workflow_query},
    {"role": "assistant", "content": initial_response.choices[0].message.content},
    {"role": "user", "content": "Research current retail industry trends and supply chain forecasts for electronics category."}
]

market_research_response = client.chat.completions.create(
    model="diffbot-small-xl",
    messages=messages
)

print("\n=== Market Research Analysis ===")
print(market_research_response.choices[0].message.content)
Output:
=== Market Research Analysis ===
Current Electronics Retail Trends:
– Technology-driven solutions demand increasing across automotive, industrial automation, consumer electronics
– Strong push towards omnichannel strategies and unified commerce (Centric Software)
– Companies prioritizing ESG initiatives and sustainable practicesSupply Chain Forecasts:
– Notable shift towards localizing supply chains to mitigate global volatility risks
– Digitalization and automation investments rising in logistics and procurement
– Industry faces challenges: geopolitical instability, increased costs, labor shortagesMarket Insights: Electronics retailers should plan for supply chain resilience and technology integration…
Step 3: Inventory Optimization Strategy
Now we’ll combine our seasonal patterns from Step 1 with the market trends from Step 2 to calculate optimal inventory levels. This final step translates our analysis into actionable procurement recommendations with specific safety stock adjustments.
# Add to conversation thread
messages.extend([
    {"role": "assistant", "content": market_research_response.choices[0].message.content},
    {"role": "user", "content": "Calculate optimal inventory levels considering our seasonal patterns and current market conditions."}
])

inventory_strategy_response = client.chat.completions.create(
    model="diffbot-small-xl",
    messages=messages
)

print("\n=== Inventory Strategy Recommendations ===")
print(inventory_strategy_response.choices[0].message.content)
Output:
=== Inventory Strategy Recommendations ===
Quarter Historical Sales Seasonal Index Recommended Stock Level Lead Time Planning Q1 1,200 units 0.96 1,200 + 25% safety 8-12 weeks Q2 800 units 0.64 800 + 25% safety 8-12 weeks Q3 900 units 0.72 900 + 25% safety 8-12 weeks Q4 2,100 units 1.68 2,100 + 30% safety 10-14 weeks
javascript
// Quarterly inventory optimization with safety stock calculations
...
Key Insights:
– Q4 peak season requires 68% above-average inventory levels
– Safety stock increased 25-30% for supply chain volatility
– Extended lead times account for current market disruptions
Deploy Your Own Conversational Analytics Dashboard
With these capabilities, we can build a Streamlit dashboard that provides two core features:
- A/B Test Analyzer: Input control and treatment group data to get comprehensive statistical analysis with transparent JavaScript calculations, p-values, confidence intervals, and recommendations.
- Real-time Market Research: Research any topic with current data and proper citations.
Try it yourself:
- Live demo – See the features in action
- GitHub repository – Get the complete code and deploy your own dashboard
Conclusion
The future of data analysis lies in tools that combine computational precision with conversational flexibility. Diffbot LLM provides this foundation today, enabling more efficient and reliable analytical workflows.
By deploying your own conversational analytics dashboard, you can democratize access to advanced statistical analysis and real-time market research within your organization. The simple Streamlit interface makes these powerful capabilities accessible to non-technical users while maintaining the precision and transparency that data professionals require.
Related Resources
For deeper exploration of AI-powered data analysis:
- Multi-Agent Workflows: Building coordinated AI agents with LangGraph for complex analytical pipelines
- Structured Outputs: Enforcing structured outputs from LLMs with PydanticAI for reliable data validation
📚 Want to go deeper? Learning new techniques is the easy part. Knowing how to structure, test, and deploy them is what separates side projects from real work. My book shows you how to build data science projects that actually make it to production. Get the book →
Stay Current with CodeCut
Actionable Python tips, curated for busy data pros. Skim in under 2 minutes, three times a week.