
In machine learning, imbalanced datasets can lead to biased models that perform poorly on minority classes. This is particularly problematic in critical applications like fraud detection or disease diagnosis.
With imbalanced-learn, you can rebalance your dataset using various sampling techniques that work seamlessly with scikit-learn.
To demonstrate this, let’s generate a sample dataset with 5000 samples, 2 features, and 4 classes:
# Libraries for plotting
import matplotlib.pyplot as plt
from mlxtend.plotting import plot_decision_regions

# Libraries for machine learning
from sklearn.datasets import make_classification
from sklearn.svm import LinearSVC
from imblearn.over_sampling import RandomOverSampler
X, y = make_classification(
n_samples=5000,
n_features=2,
n_informative=2,
n_redundant=0,
n_repeated=0,
n_classes=4,
n_clusters_per_class=1,
weights=[0.01, 0.04, 0.5, 0.90],
class_sep=0.8,
random_state=0,
)Resample the dataset using the RandomOverSampler class from imbalanced-learn to balance the class distribution. This technique works by duplicating minority samples until they match the majority class.
ros = RandomOverSampler(random_state=1)
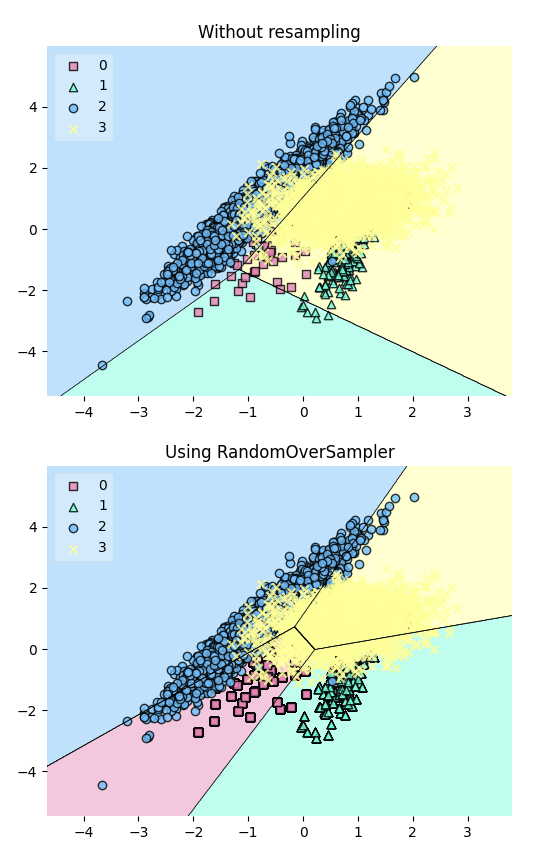
X_resampled, y_resampled = ros.fit_resample(X, y)Plot the decision regions of the dataset before and after resampling using a LinearSVC classifier:
# Plotting Decision Regions
fig, (ax0, ax1) = plt.subplots(nrows=2, ncols=1, sharey=True, figsize=(6, 10))

for Xi, yi, ax, title in zip(
    [X, X_resampled],
    [y, y_resampled],
    [ax0, ax1],
    ["Without resampling", "Using RandomOverSampler"],
):
    clf = LinearSVC()
    clf.fit(Xi, yi)
    fig = plot_decision_regions(X=Xi, y=yi, clf=clf, legend=2, ax=ax)
    plt.title(title)
The plot reveals that the resampling process has added more data points to the minority class (green), effectively balancing the class distribution.