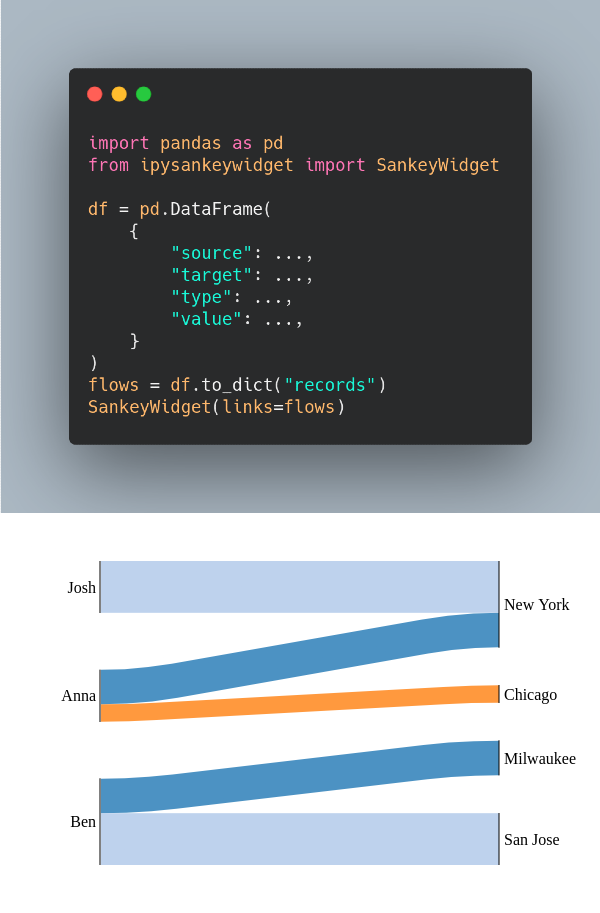
Sankey diagram is a flow diagram that depicts flows, where the width of the lines is proportional to the flow rate.
If you want to quickly create a Sankey diagram in your Jupyter Notebook, use ipysankeywidget.
Sankey diagram is a flow diagram that depicts flows, where the width of the lines is proportional to the flow rate.
If you want to quickly create a Sankey diagram in your Jupyter Notebook, use ipysankeywidget.