

If you want to generate stunning maps from OpenStreetMap data in Python, use Prettymaps. In this post, we’ll explore how to use Prettymaps to create beautiful maps with ease.
Getting Started
To get started with Prettymaps, you’ll need to install the library using pip:
pip install -U prettymaps "osmnx>=1.9.3,<2.0" "git+https://github.com/abey79/vsketch@1.0.0"Basic Usage
Once you have Prettymaps installed, you can start creating maps with just a few lines of code. Plotting with prettymaps is very simple. Run:
prettymaps.plot(your_query)your_query can be:
- An address (Example: “Porto Alegre”),
- Latitude / Longitude coordinates (Example: (-30.0324999, -51.2303767))
- A custom boundary in GeoDataFrame format
Here’s an example:
import prettymaps

plot = prettymaps.plot('Stad van de Zon, Heerhugowaard, Netherlands')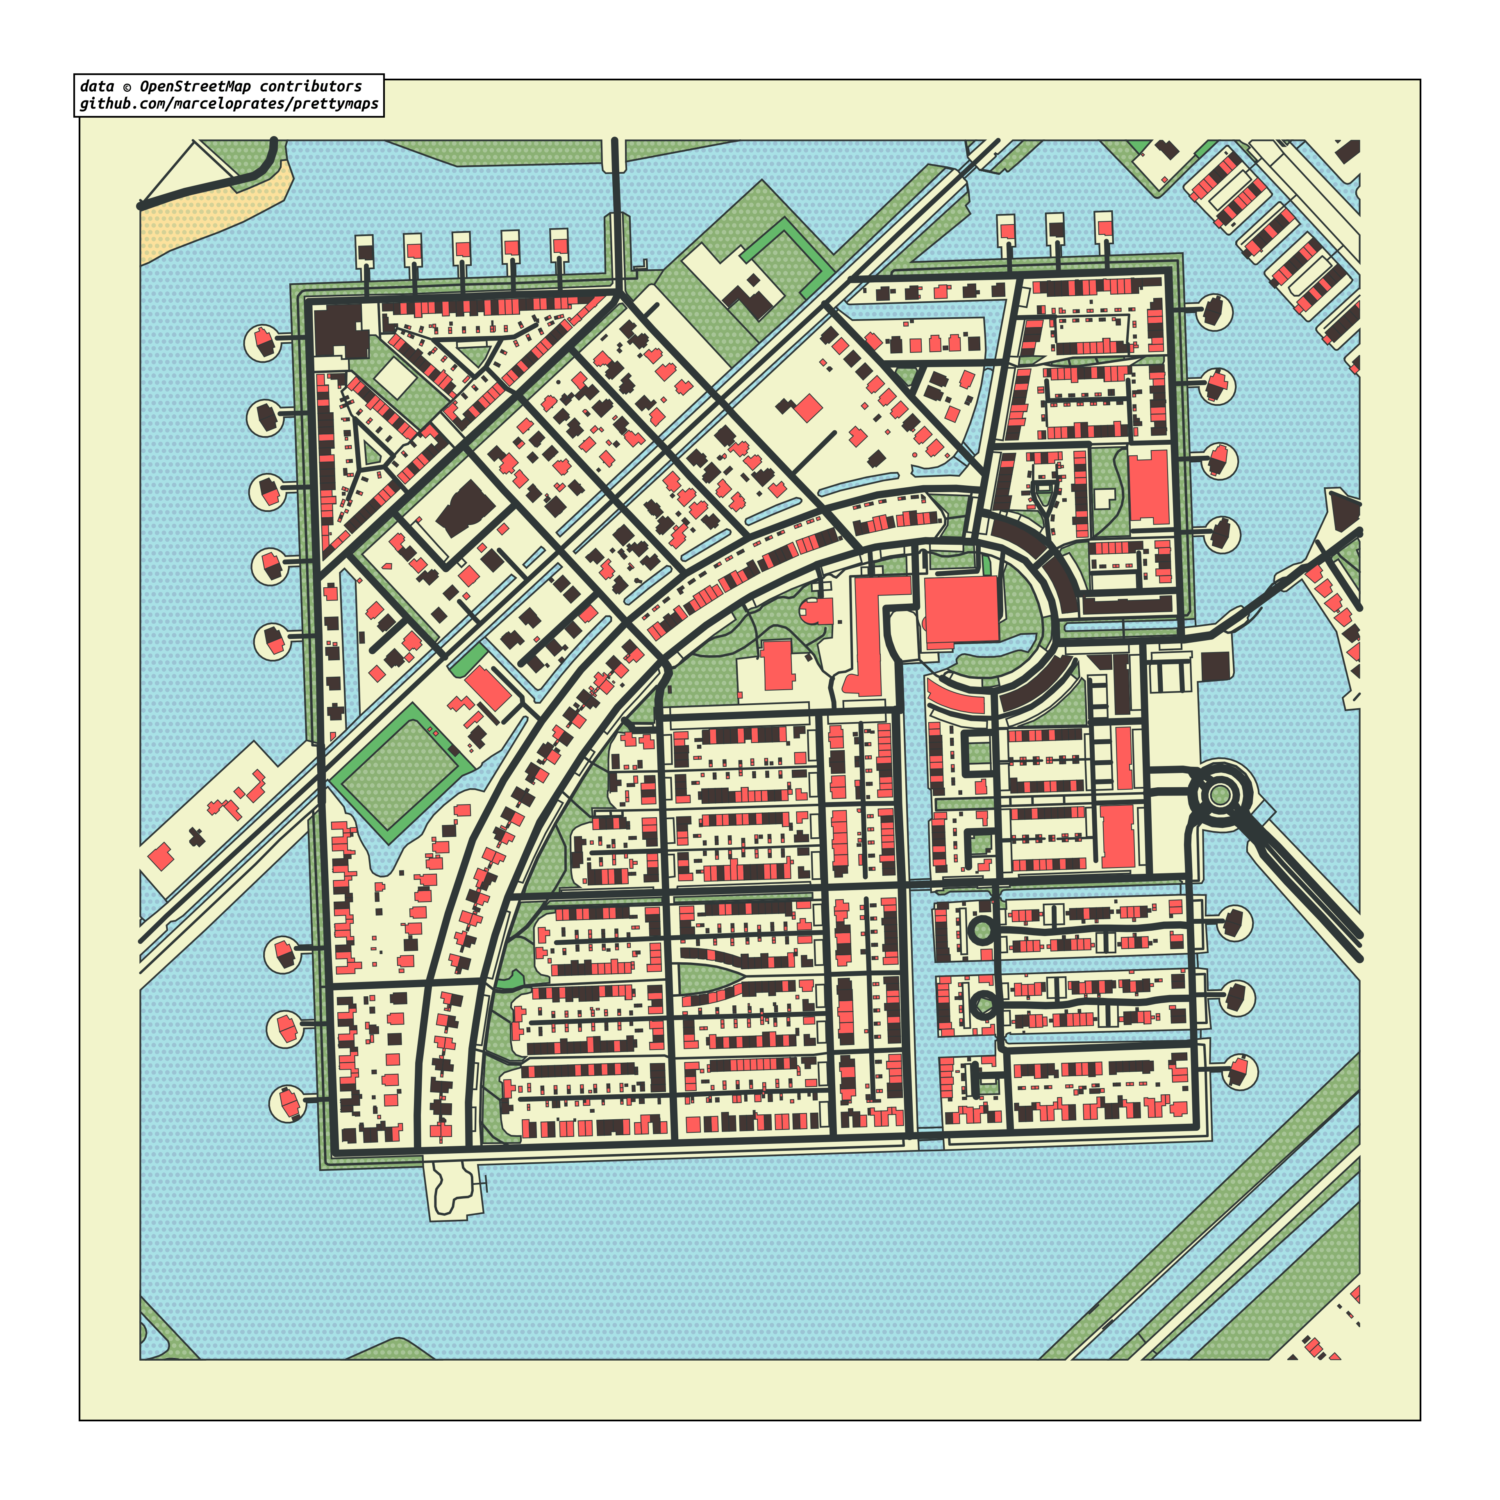
This will generate a beautiful map of the specified location.
Customizing Your Map
Prettymaps offers a range of options for customizing your map. For example, you can add a circle around the location:
plot = prettymaps.plot('Stad van de Zon, Heerhugowaard, Netherlands', circle=True)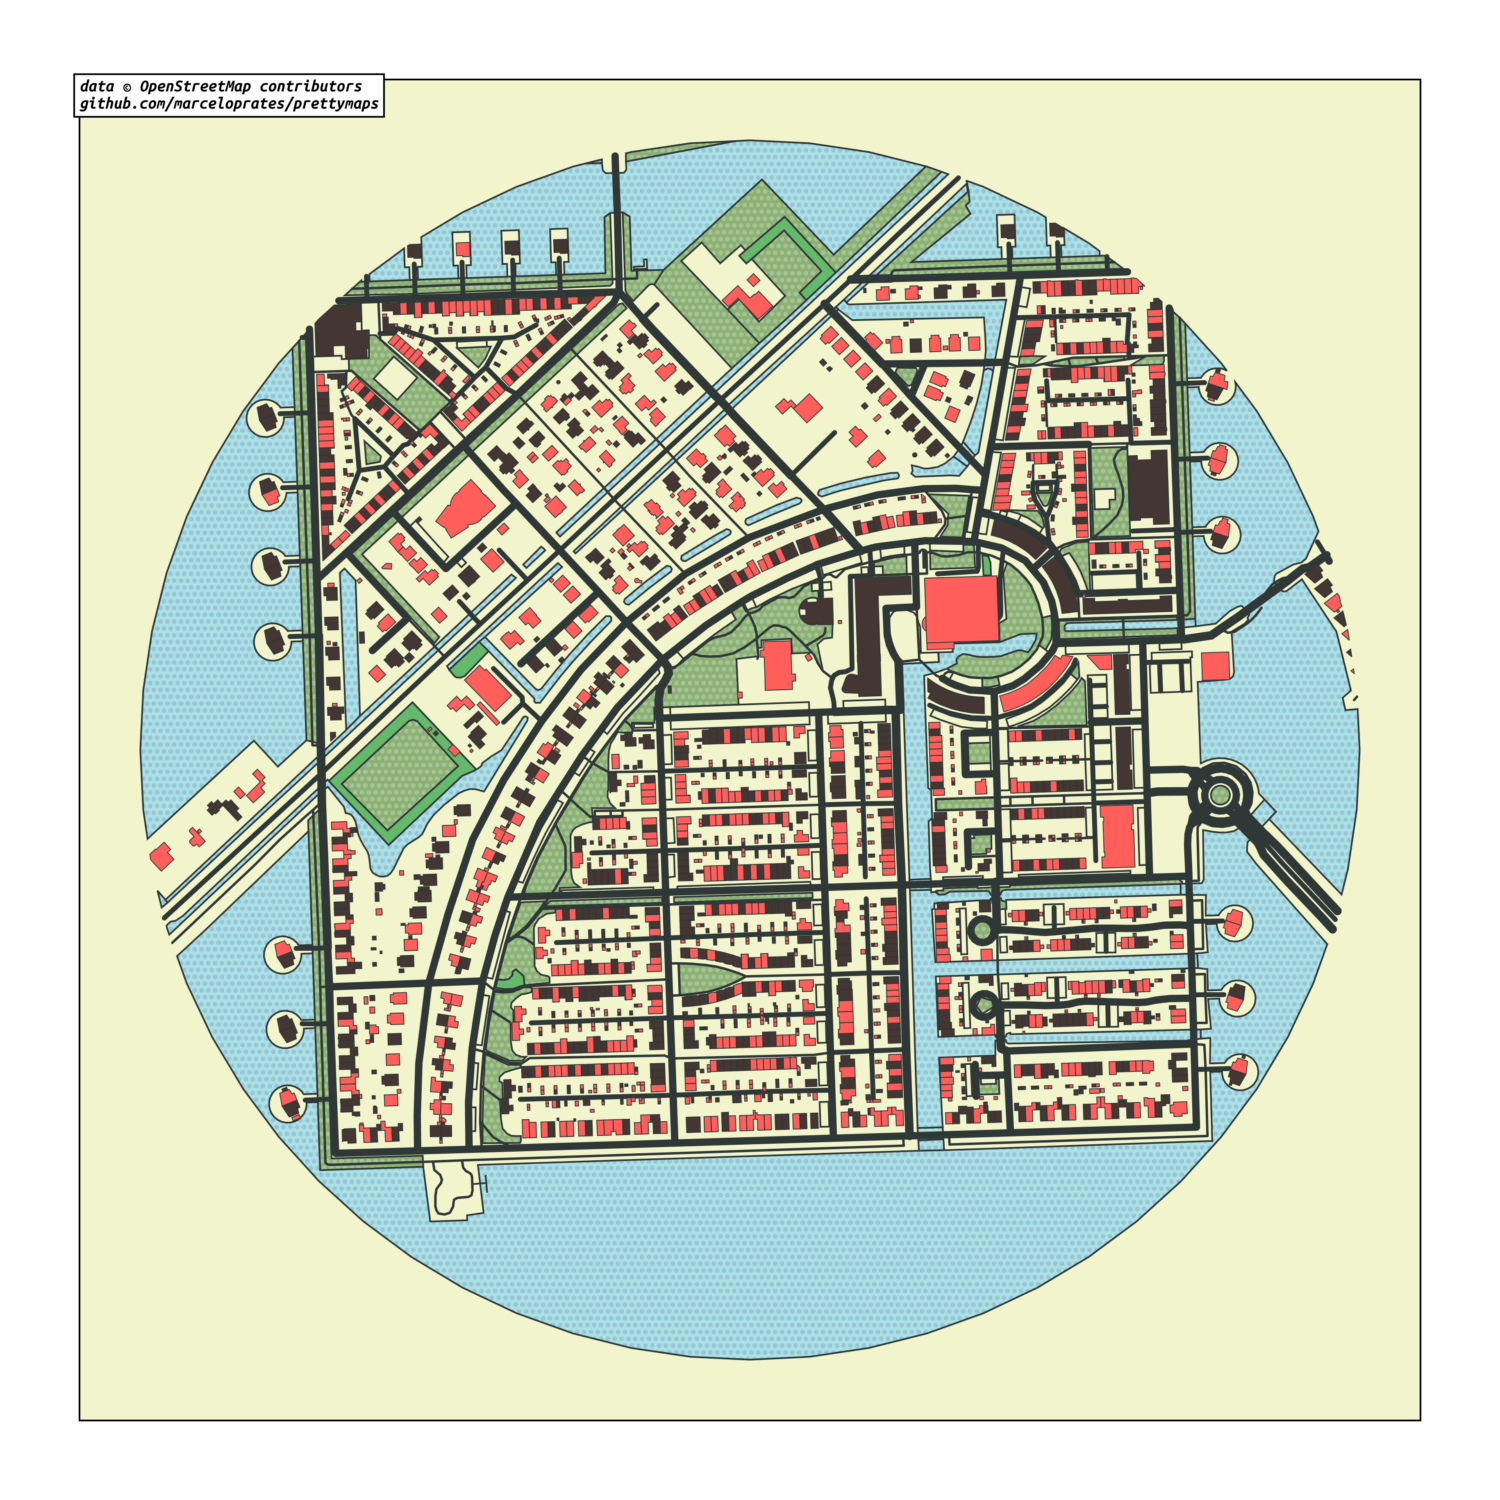
Using Presets
Prettymaps also comes with a range of presets that you can use to customize your map. For example:
plot = prettymaps.plot('Stad van de Zon, Heerhugowaard, Netherlands', preset='minimal')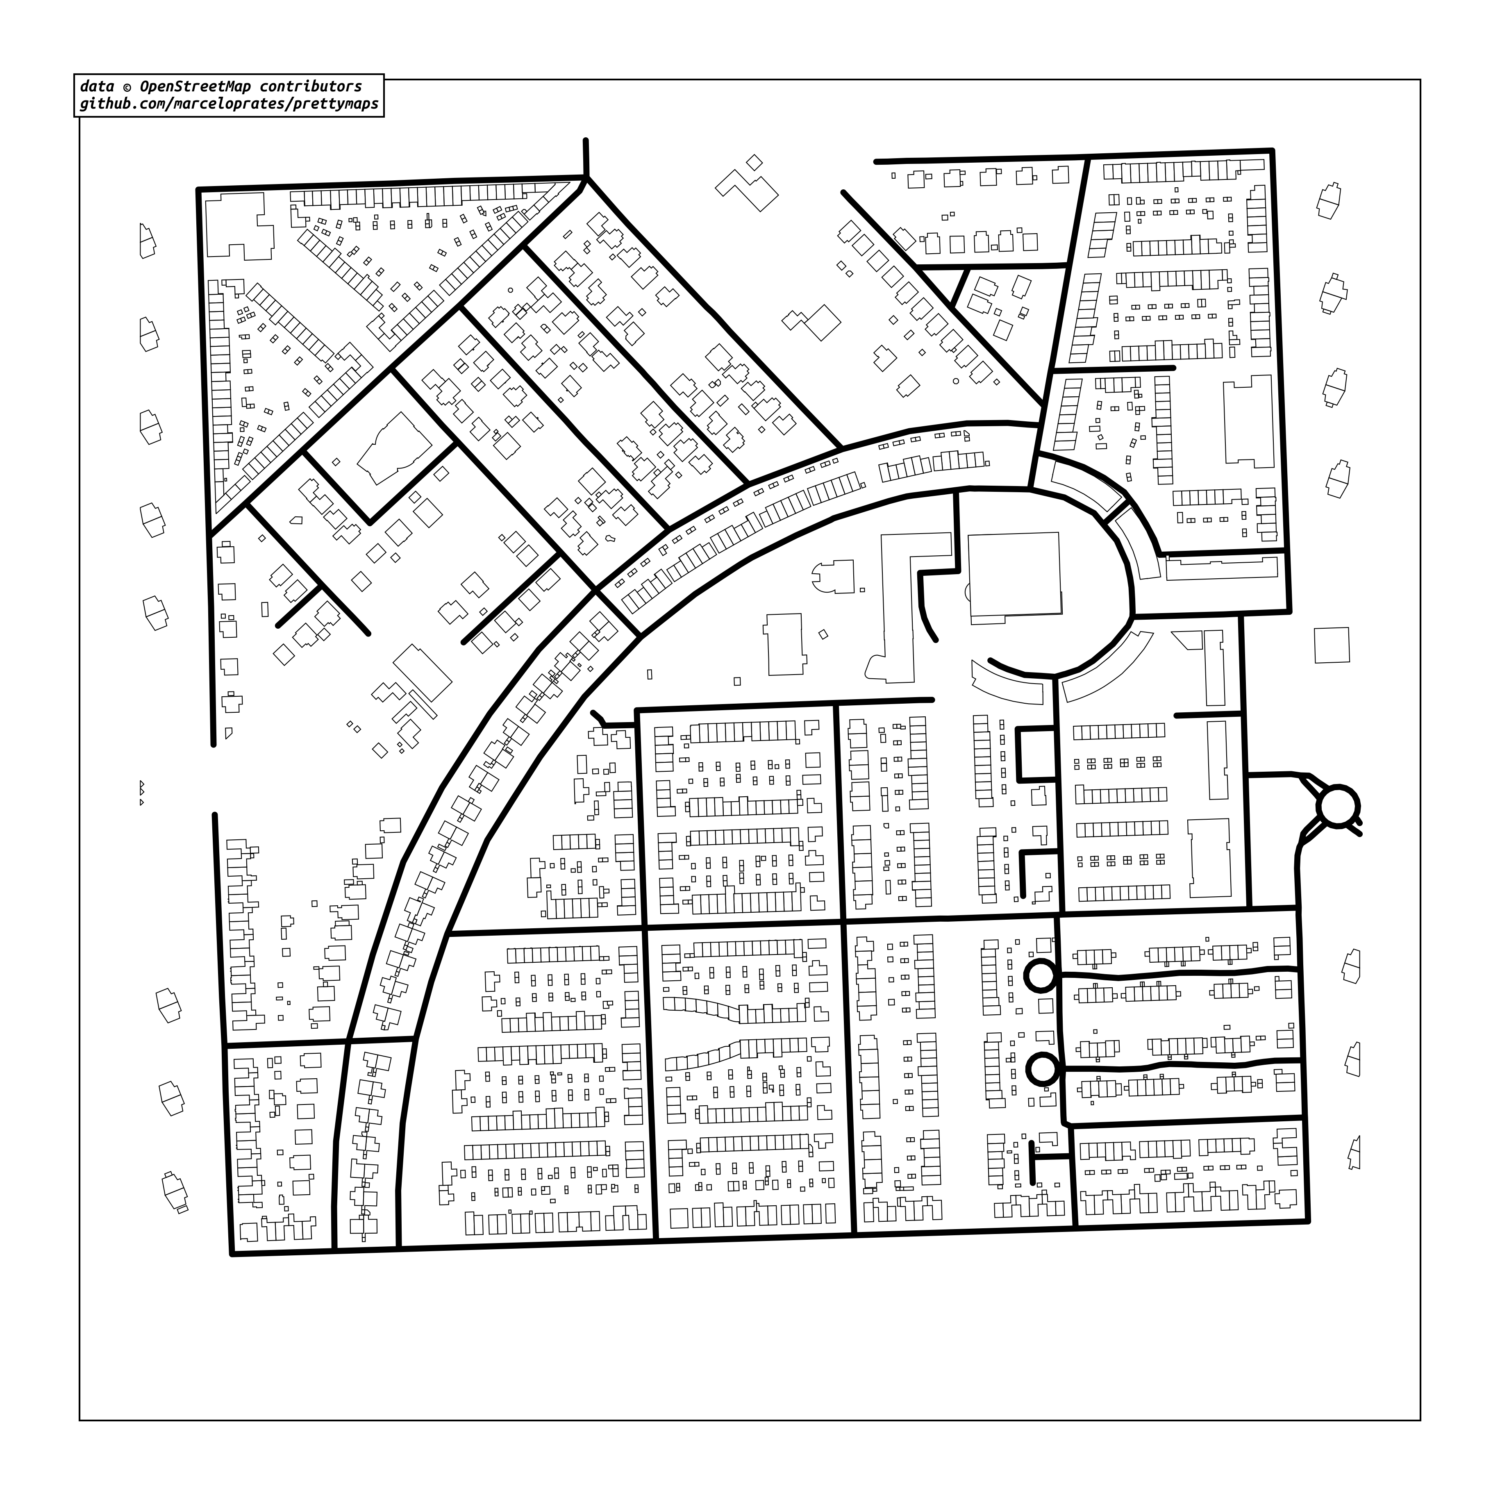
plot = prettymaps.plot('Stad van de Zon, Heerhugowaard, Netherlands', preset='barcelona')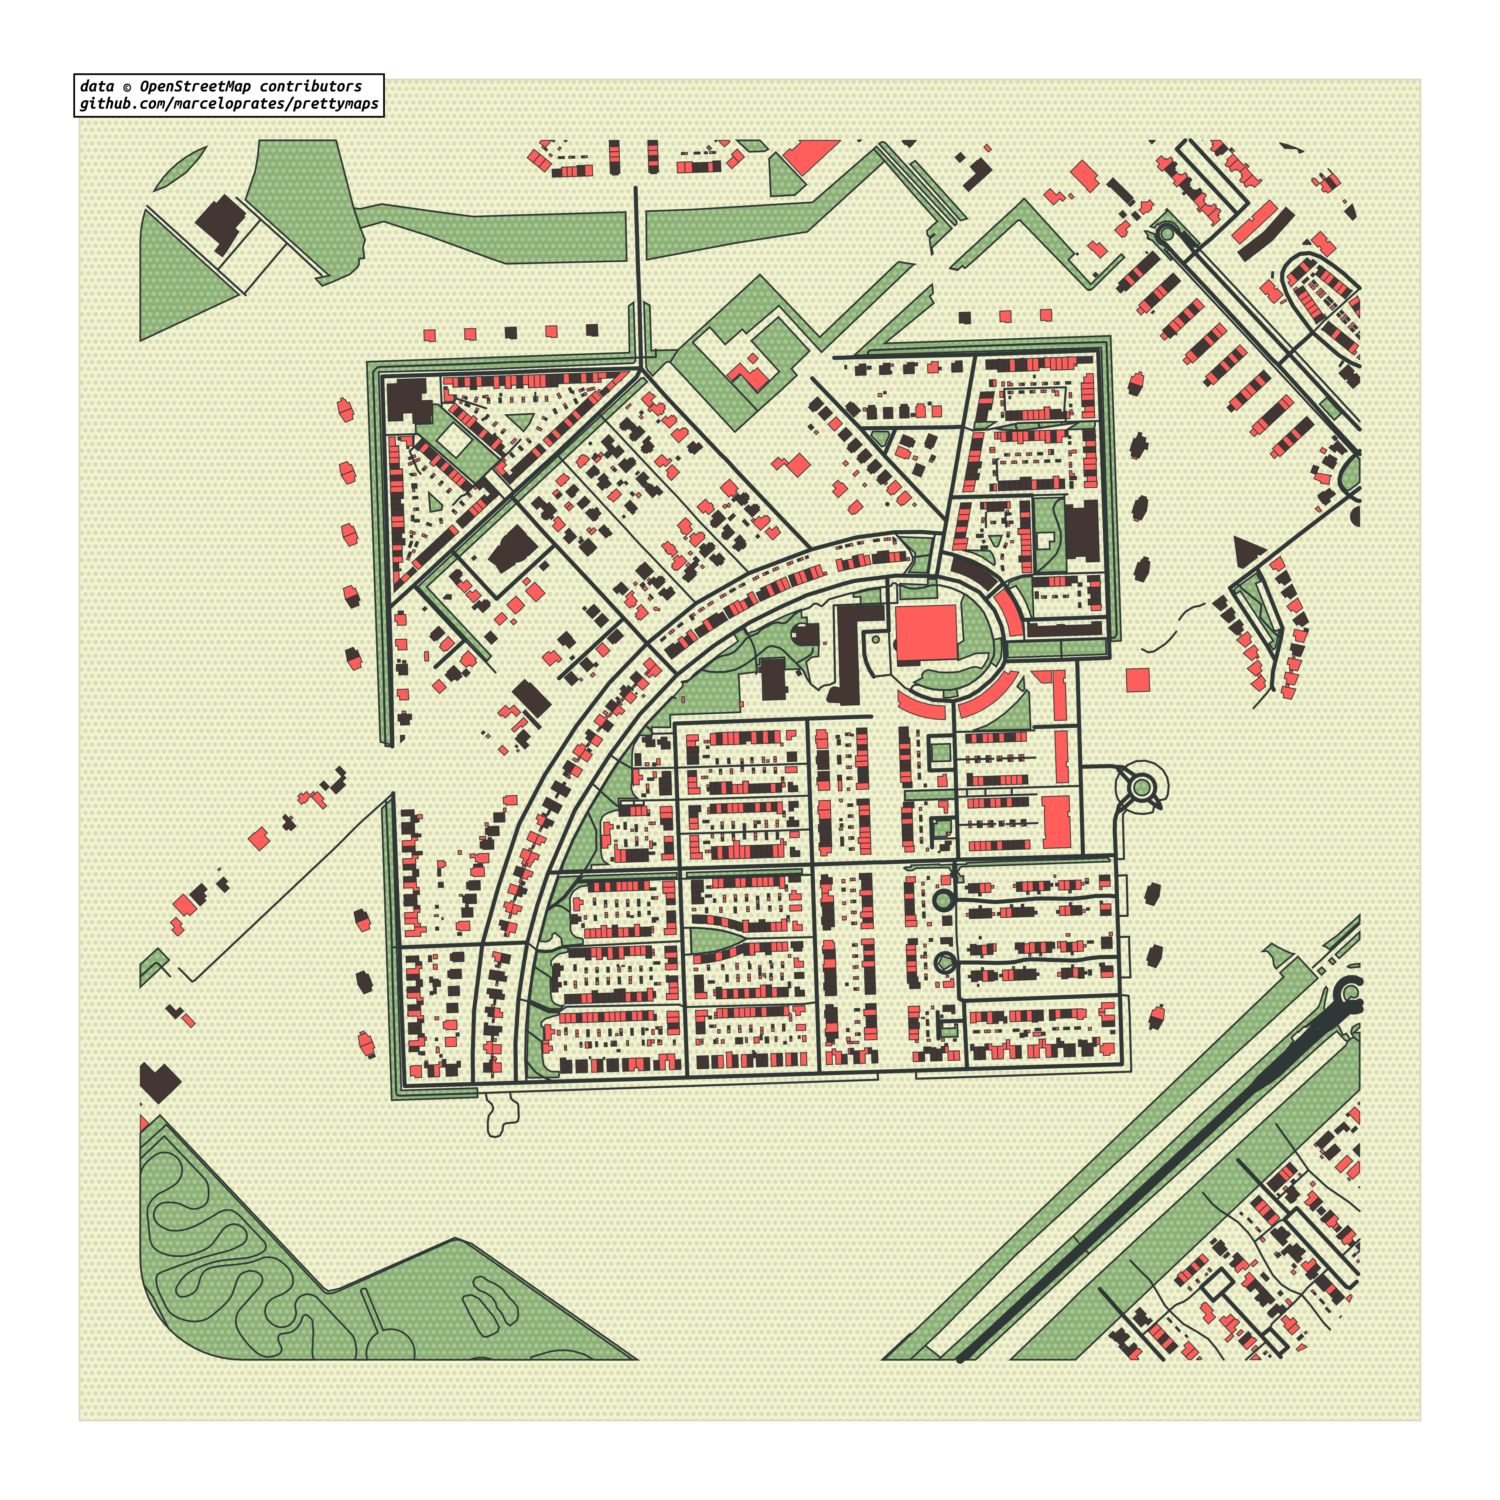
You can view a list of available presets using the presets() function:
prettymaps.presets()This will output a table showing the available presets and their parameters.
| preset | params | |
|---|---|---|
| 0 | abraca-redencao | {‘layers’: {‘perimeter’: {}, ‘streets’: {‘widt… |
| 1 | barcelona | {‘layers’: {‘perimeter’: {‘circle’: False}, ‘s… |
| 2 | barcelona-plotter | {‘layers’: {‘streets’: {‘width’: {‘primary’: 5… |
| 3 | cb-bf-f | {‘layers’: {‘streets’: {‘width’: {‘trunk’: 6, … |
| 4 | default | {‘layers’: {‘perimeter’: {}, ‘streets’: {‘widt… |
| 5 | heerhugowaard | {‘layers’: {‘perimeter’: {}, ‘streets’: {‘widt… |
| 6 | macao | {‘layers’: {‘perimeter’: {}, ‘streets’: {‘cust… |
| 7 | minimal | {‘layers’: {‘perimeter’: {}, ‘streets’: {‘widt… |
| 8 | plotter | {‘layers’: {‘perimeter’: {}, ‘streets’: {‘widt… |
| 9 | tijuca | {‘layers’: {‘perimeter’: {}, ‘streets’: {‘widt… |
Conclusion
Prettymaps is a powerful library for creating beautiful maps from OpenStreetMap data in Python. With its easy-to-use interface and range of customization options, it’s the perfect tool for anyone looking to create stunning maps.


2 thoughts on “How to Create Beautiful Maps in Python Using Prettymaps Library”
Hi there, thank you for this website that I discovered recently !!!
I tried to install the library, and I faced this issue :
ERROR: Could not find a version that satisfies the requirement osmnx==1.2.2 (from prettymaps) (from versions: 0.1a1, 0.1b1, 0.1b2, 0.1, 0.2, 0.2.1, 0.2.2, 0.3, 0.3.1, 0.4, 0.4.1, 0.5, 0.5.1, 0.5.2, 0.5.3, 0.5.4, 0.6, 0.7, 0.7.1, 0.7.2, 0.7.3, 0.7.4, 0.8, 0.8.1, 0.8.2, 0.9, 0.10, 0.11, 0.11.1, 0.11.2, 0.11.3, 0.11.4, 0.12, 0.12.1, 0.13.0, 0.14.0, 0.14.1, 0.15.0, 0.15.1, 0.16.0, 0.16.1, 0.16.2, 1.0.0, 1.0.1, 1.1.0, 1.1.1, 1.1.2)
ERROR: No matching distribution found for osmnx==1.2.2 (from prettymaps)
Hi MO, thanks for subscribing to the website! I’m not sure why you faced that issue. I suggest that you open an issue on prettymaps to get support from the maintainers of the library