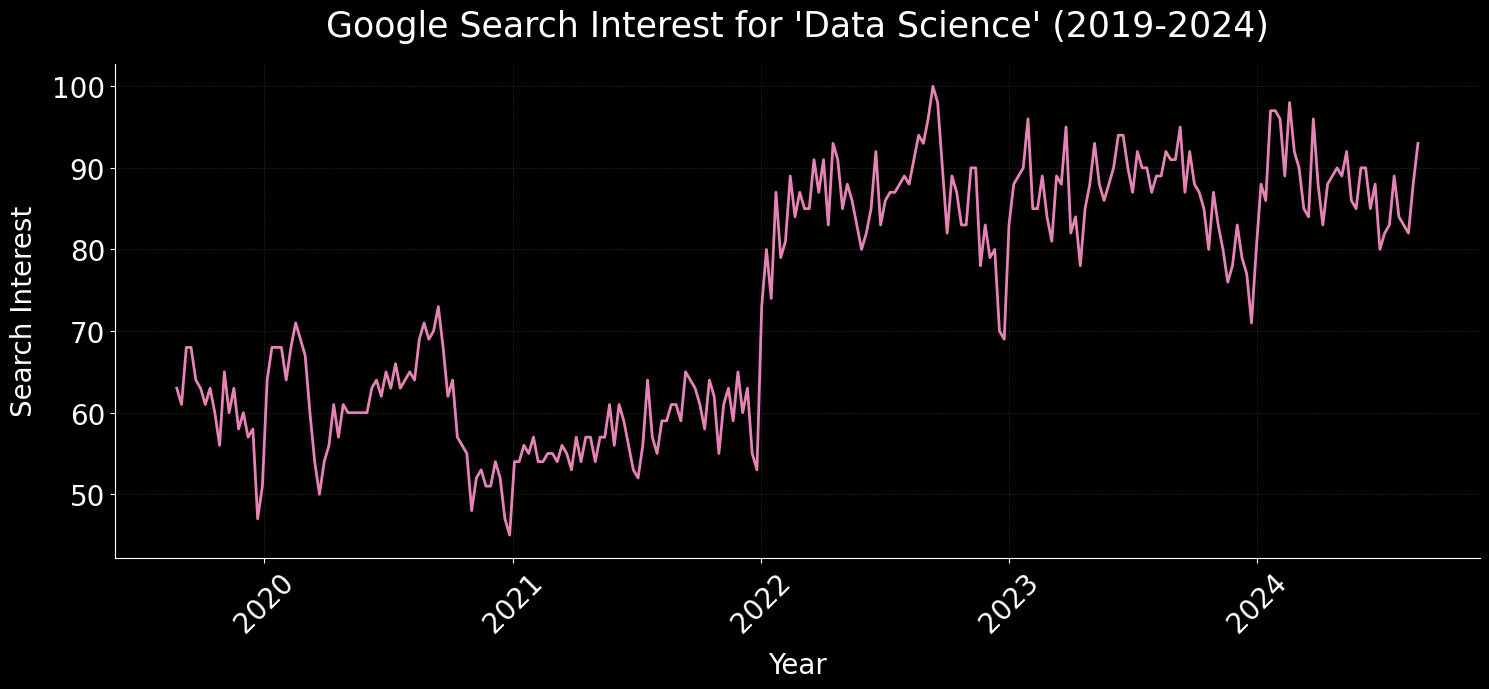
Google Trends provides valuable insights into search patterns and public interest over time. Pytrends, an unofficial API for Google Trends, offers a simple way to access and analyze this data programmatically.
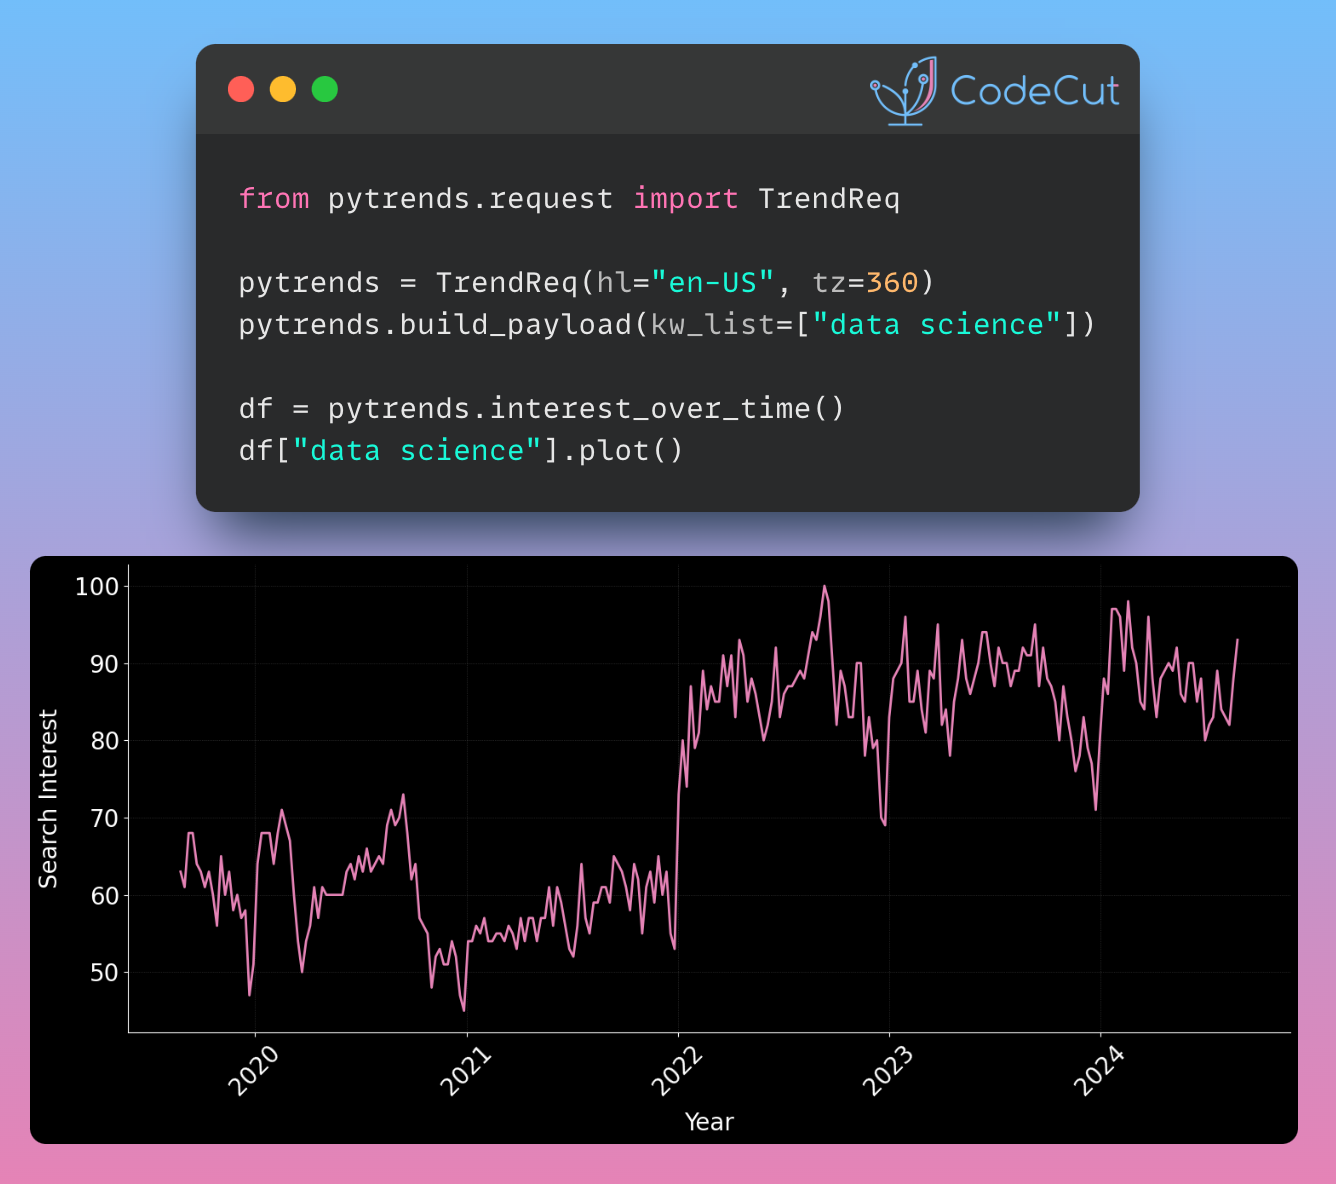
To track a keyword’s trend on Google Search, you can use pytrends. Here’s an example that shows the interest in “data science” from 2019 to 2024:
from pytrends.request import TrendReq

pytrends = TrendReq(hl="en-US", tz=360)
pytrends.build_payload(kw_list=["data science"])

df = pytrends.interest_over_time()
df["data science"].plot(figsize=(20, 7))
Pytrends allows you to easily access various types of trend data, including interest by region, related topics, and queries, making it a powerful tool for researchers, marketers, and data analysts.


2 thoughts on “Exploring Google Trends with Pytrends API”
I use the following code but didn’t see any chart! What’s wrong?
from pytrends.request import TrendReq
import plotly.express as px
pytrends =TrendReq (hl=’en-US’, tz=360)
pytrends.build_payload(kw_list=[‘Dogecoin’])
df = pytrends.interest_over_time()
px.line(df[‘Dogecoin’])
Hi Mahbub, you need to run code on Jupyter Notebook to see any chart. Have you tried that yet?