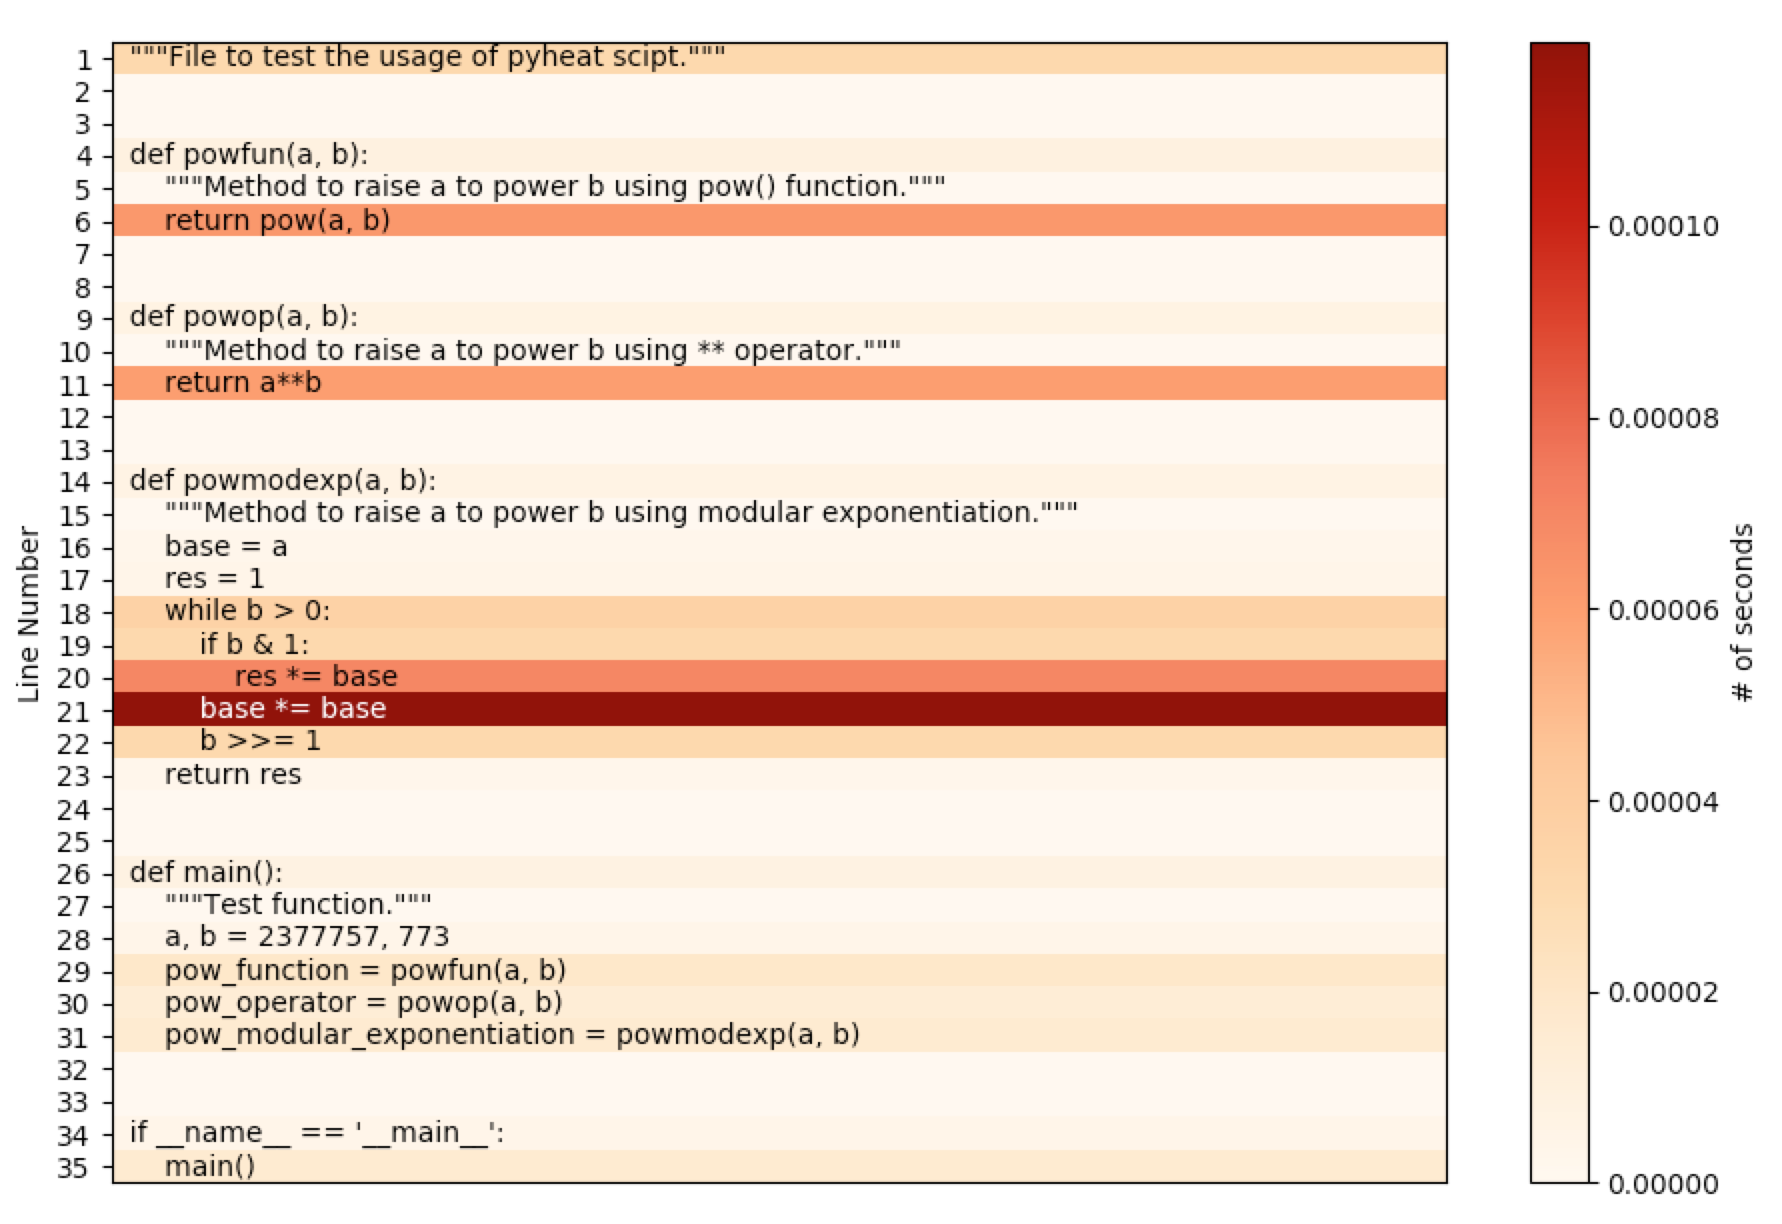
Profiling your code is helpful, but looking at data in a table can be a real headache.
Wouldn’t it be nice if you could see your code’s time distribution as a heatmap? That is when pyheat comes in handy.
Profiling your code is helpful, but looking at data in a table can be a real headache.
Wouldn’t it be nice if you could see your code’s time distribution as a heatmap? That is when pyheat comes in handy.