The Problem with Manual Comparison
Comparing two datasets is a common task in data analysis and engineering, particularly when validating data transformation logic, quality checks, or migration processes.
Without a dedicated library, comparing datasets often involves writing complex code to compare values, identify mismatches, and generate comparison reports. This approach is time-consuming and prone to errors.
Let’s consider two sample datasets, df1 and df2, in the form of Pandas DataFrames.
import pandas as pd
data1 = """acct_id,dollar_amt,name,float_fld,date_fld
10000001234,123.45,George Maharis,14530.1555,2017-01-01
10000001235,0.45,Michael Bluth,1,2017-01-01
10000001236,1345,George Bluth,,2017-01-01
10000001237,123456,Bob Loblaw,345.12,2017-01-01
10000001238,1.05,Lucille Bluth,,2017-01-01
10000001238,1.05,Loose Seal Bluth,,2017-01-01
"""
df1 = pd.read_csv(StringIO(data1))
data2 = """acct_id,dollar_amt,name,float_fld
10000001234,123.4,George Michael Bluth,14530.155
10000001235,0.45,Michael Bluth,
10000001236,1345,George Bluth,1
10000001237,123456,Robert Loblaw,345.12
10000001238,1.05,Loose Seal Bluth,111
"""
df2 = pd.read_csv(StringIO(data2))Comparing these datasets manually requires complex code:
# Check if shapes match
shape_match = df1.shape == df2.shape

# Compare values
merged = df1.merge(df2, on=['acct_id', 'name'], how='outer', suffixes=('_1', '_2'))
mismatches = merged[merged['dollar_amt_1'] != merged['dollar_amt_2']]
missing = merged[merged['dollar_amt_1'].isna() | merged['dollar_amt_2'].isna()]

# Manual reporting
print(f"Shapes match: {shape_match}")
print("\nMismatches:")
print(mismatches)
print("\nMissing records:")
print(missing)
Outputs:
Shapes match: False

Mismatches:
       acct_id  dollar_amt_1                  name  float_fld_1    date_fld  \
0  10000001234        123.45        George Maharis   14530.1555  2017-01-01
3  10000001237     123456.00            Bob Loblaw     345.1200  2017-01-01
4  10000001238          1.05         Lucille Bluth          NaN  2017-01-01
6  10000001234           NaN  George Michael Bluth          NaN         NaN
7  10000001237           NaN         Robert Loblaw          NaN         NaN

   dollar_amt_2  float_fld_2
0           NaN          NaN
3           NaN          NaN
4           NaN          NaN
6         123.4    14530.155
7      123456.0      345.120

Missing records:
       acct_id  dollar_amt_1                  name  float_fld_1    date_fld  \
0  10000001234        123.45        George Maharis   14530.1555  2017-01-01
3  10000001237     123456.00            Bob Loblaw     345.1200  2017-01-01
4  10000001238          1.05         Lucille Bluth          NaN  2017-01-01
6  10000001234           NaN  George Michael Bluth          NaN         NaN
7  10000001237           NaN         Robert Loblaw          NaN         NaN

   dollar_amt_2  float_fld_2
0           NaN          NaN
3           NaN          NaN
4           NaN          NaN
6         123.4    14530.155
7      123456.0      345.120
Introducing Datacompy
Datacompy is a Python library that simplifies dataset comparison by providing a single interface for joining, comparison logic, and reporting. It supports various data frameworks, including Pandas, Spark, Polars, and Snowflake.
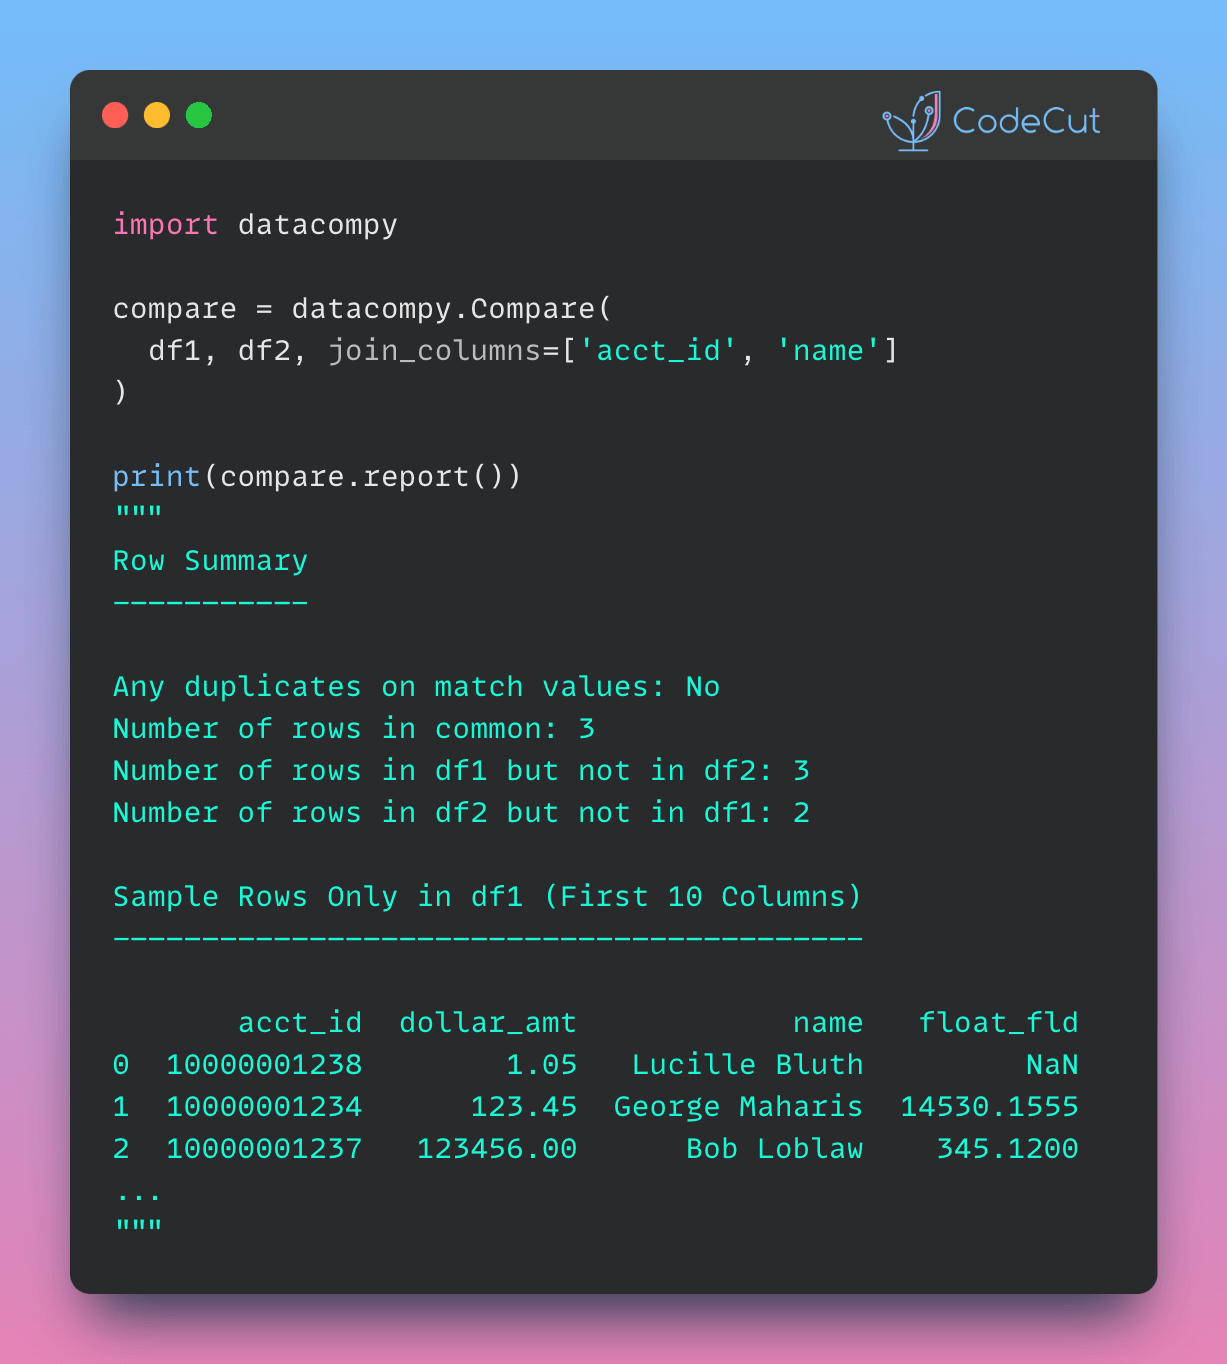
To compare two datasets, we create a Compare object and pass in the two DataFrames, along with the join columns.
import datacompy

compare = datacompy.Compare(df1, df2, join_columns=['acct_id', 'name'])
To generate a detailed comparison report, we can call the report() method on the Compare object.
print(compare.report())Output:
DataComPy Comparison
--------------------

DataFrame Summary
-----------------

  DataFrame  Columns  Rows
0       df1        5     6
1       df2        4     5

Column Summary
--------------

Number of columns in common: 4
Number of columns in df1 but not in df2: 1 ['date_fld']
Number of columns in df2 but not in df1: 0 []

Row Summary
-----------

Matched on: acct_id, name
Any duplicates on match values: No
Absolute Tolerance: 0
Relative Tolerance: 0
Number of rows in common: 3
Number of rows in df1 but not in df2: 3
Number of rows in df2 but not in df1: 2

Number of rows with some compared columns unequal: 3
Number of rows with all compared columns equal: 0

Column Comparison
-----------------

Number of columns compared with some values unequal: 1
Number of columns compared with all values equal: 3
Total number of values which compare unequal: 3

Columns with Unequal Values or Types
------------------------------------

      Column df1 dtype df2 dtype  # Unequal  Max Diff  # Null Diff
0  float_fld   float64   float64          3       NaN            3

Sample Rows with Unequal Values
-------------------------------

       acct_id              name  float_fld (df1)  float_fld (df2)
0  10000001236      George Bluth              NaN              1.0
1  10000001238  Loose Seal Bluth              NaN            111.0
2  10000001235     Michael Bluth              1.0              NaN

Sample Rows Only in df1 (First 10 Columns)
------------------------------------------

       acct_id  dollar_amt            name   float_fld    date_fld
0  10000001238        1.05   Lucille Bluth         NaN  2017-01-01
1  10000001234      123.45  George Maharis  14530.1555  2017-01-01
2  10000001237   123456.00      Bob Loblaw    345.1200  2017-01-01

Sample Rows Only in df2 (First 10 Columns)
------------------------------------------

       acct_id  dollar_amt                  name  float_fld
0  10000001237    123456.0         Robert Loblaw    345.120
1  10000001234       123.4  George Michael Bluth  14530.155
By using Datacompy, you can simplify your dataset comparison workflow and focus on more important tasks.


