Generic selectors
Exact matches only
Search in title
Search in content
Post Type Selectors
Filter by Categories
About Article
Analyze Data
Archive
Best Practices
Better Outputs
Blog
Code Optimization
Code Quality
Command Line
Daily tips
Dashboard
Data Analysis & Manipulation
Data Engineer
Data Visualization
DataFrame
Delta Lake
DevOps
DuckDB
Environment Management
Feature Engineer
Git
Jupyter Notebook
LLM
LLM
Machine Learning
Machine Learning
Machine Learning & AI
Manage Data
MLOps
Natural Language Processing
NumPy
Pandas
Polars
PySpark
Python Tips
Python Utilities
Python Utilities
Scrape Data
SQL
Testing
Time Series
Tools
Visualization
Visualization & Reporting
Workflow & Automation
Workflow Automation

Dashboard

SQLPage: Generate Web UIs From SQL Queries

Motivation

Data scientists and analysts often need to build web interfaces to share their data and analyses, but most lack web development expertise. They end up either creating static reports or relying on web developers to build interactive dashboards.

Example:

# Traditional way: Need to learn Flask/FastAPI, HTML, CSS, JavaScript
from flask import Flask, render_template
import pandas as pd

app = Flask(__name__)

@app.route('/')
def show_websites():
# Need to handle database connection
# Need to create HTML templates
# Need to style the output
websites_df = pd.read_sql("""
SELECT name, url, type, description
FROM website
""", db_connection)
return render_template('websites.html', websites=websites_df.to_dict('records'))

Introduction to SQLPage

SQLPage is a tool that automatically builds web interfaces directly from SQL queries. It eliminates the need to write any traditional web programming code by providing pre-built components that render your data.

SQL-Based Web Interface

SQLPage solves the web interface problem by letting you:

Create web pages using only SQL queries

Automatically generate styled components

Handle interactive elements without JavaScript

Create a file named dashboard.sql:

— Create a list component with a title
SELECT
'list' as component,
'Popular websites' as title;

— Query data and specify how to display each item
SELECT
name as title,
url as link,
CASE type
WHEN 1 THEN 'blue'
ELSE 'red'
END as color,
description,
icon,
active
FROM website;

The SQL code above will generate:

A styled list component with a header

Each website is displayed as a list item with:

The name as a clickable title

Color-coded items based on type

Description and icon for each website

Active state indication

Conclusion

SQLPage enables data professionals to create interactive web interfaces using only SQL, making it easier to share data insights with stakeholders. Instead of learning multiple web technologies, analysts can leverage their SQL skills to build professional-looking web applications.

Link to SQLPage
Favorite

SQLPage: Generate Web UIs From SQL Queries Read More »

Taipy: Build Responsive Interfaces in Python for Large Data

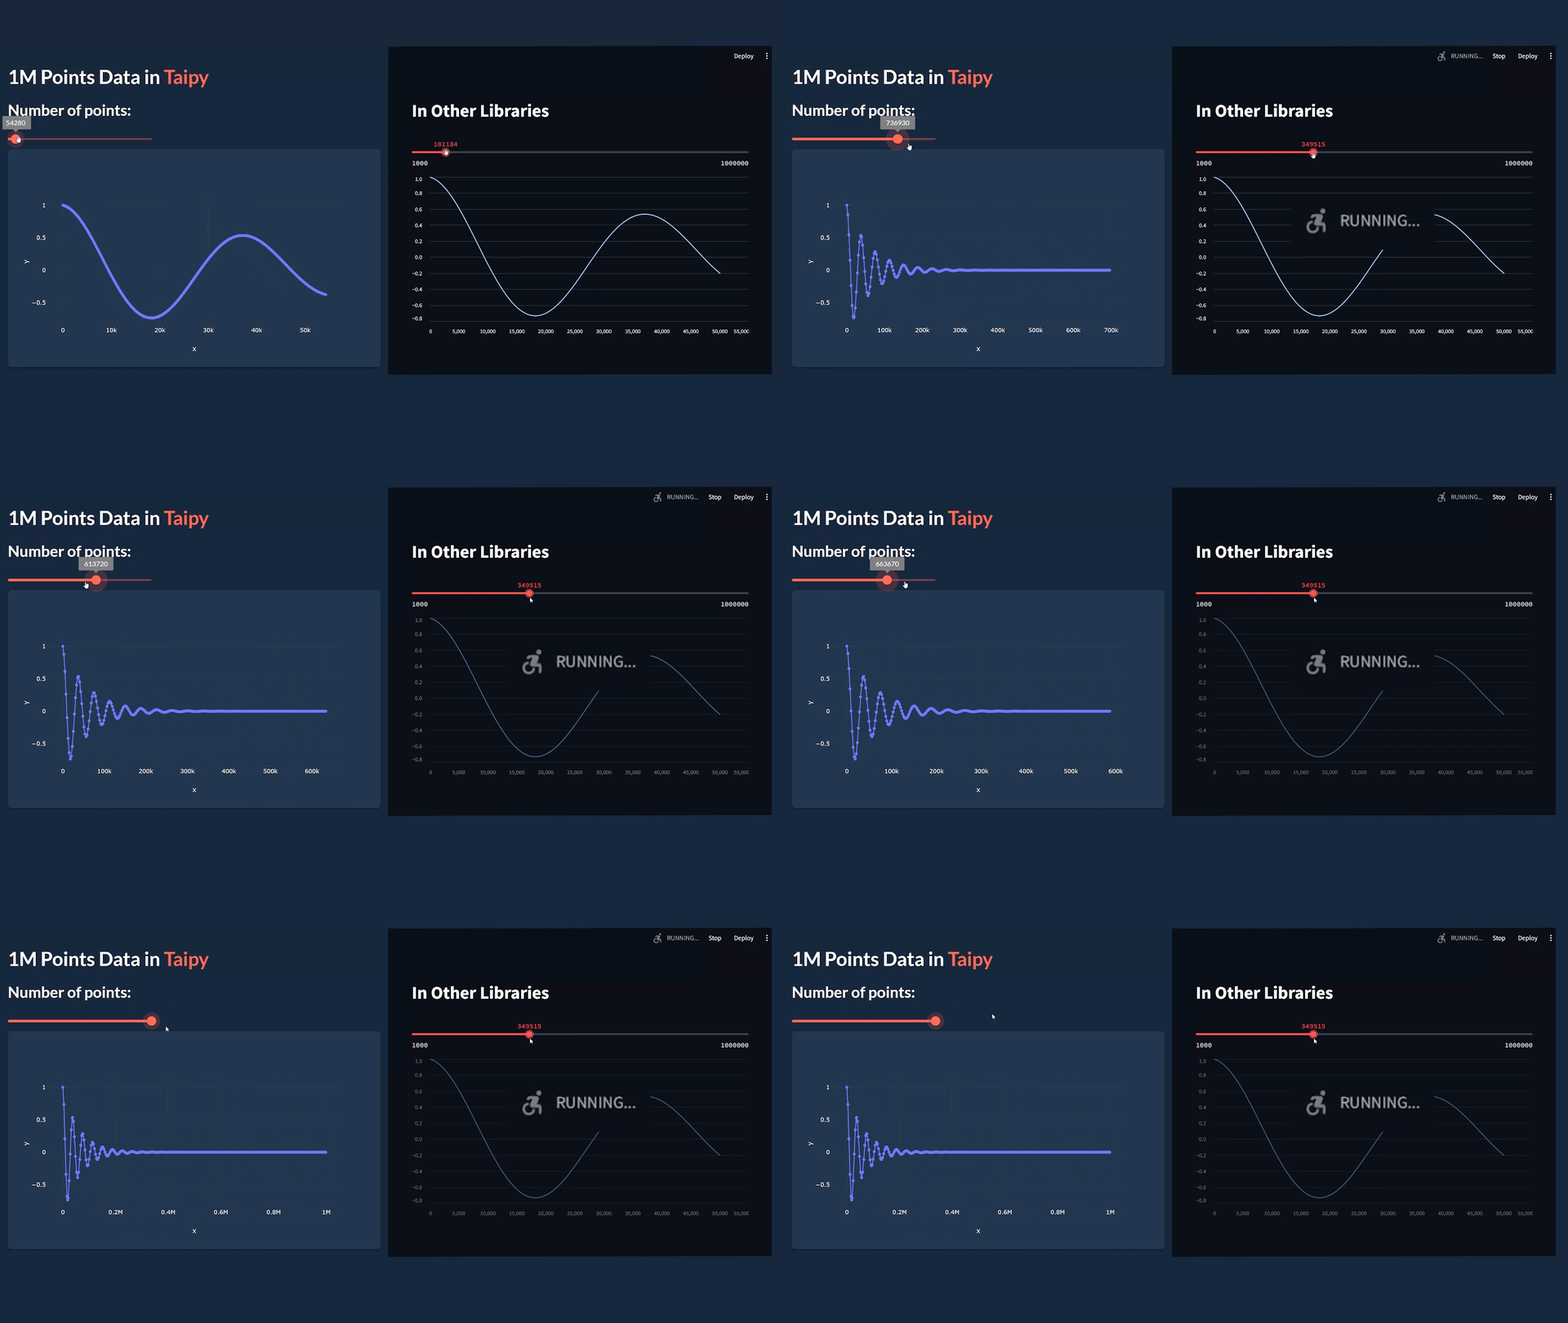
Streamlit re-runs the entire script when users interact with controls like sliders, which can cause performance issues with large datasets.

Taipy avoids this by storing variables in its State object for smoother updates.

You can build Taipy pages using either Markdown or Python syntax.

Markdown-Style Approach

from taipy.gui import Gui
from math import cos, exp

value = 10

page = """
# Taipy *Getting Started*

Value: <|{value}|text|>

<|{value}|slider|on_change=slider_moved|>

<|{data}|chart|>
"""

def slider_moved(state):
state.data = compute_data(state.value)

def compute_data(decay:int)->list:
return [cos(i/6) * exp(-i*decay/600) for i in range(100)]

data = compute_data(value)

if __name__ == "__main__":
Gui(page).run(title="Dynamic chart")

Components:

Text display: <|{value}|text|>

Slider control: <|{value}|slider|>

Data chart: <|{data}|chart|>

How It Works:

Initial value creates starting data

Slider movement triggers slider_moved

New data computed and chart updates

Python Builder Approach

from taipy.gui import Gui
import taipy.gui.builder as tgb
from math import cos, exp

value = 10

def compute_data(decay:int)->list:
return [cos(i/6) * exp(-i*decay/600) for i in range(100)]

def slider_moved(state):
state.data = compute_data(state.value)

with tgb.Page() as page:
tgb.text(value="# Taipy Getting Started", mode="md")
tgb.text(value="Value: {value}")
tgb.slider(value="{value}", on_change=slider_moved)
tgb.chart(data="{data}")

data = compute_data(value)

if __name__ == "__main__":
Gui(page=page).run(title="Dynamic chart")

Components:

Text: tgb.text()

Slider: tgb.slider()

Chart: tgb.chart()

How It Works:

Components created programmatically

Same data flow as Markdown approach

Real-time updates through State management

Link to Taipy.
Favorite

Taipy: Build Responsive Interfaces in Python for Large Data Read More »

Simplify Scenario Analysis in Python with Taipy

Comparing outcomes across different scenarios is essential for decision-making and strategic planning in various fields.

For example, by comparing sales predictions under various scenarios, retailers can more accurately forecast inventory needs, reducing the risk of overstocking.

Taipy, an open-source Python library, simplifies scenario creation and provides interactive UI components to visualize outcomes.

Link to Taipy.
Favorite

Simplify Scenario Analysis in Python with Taipy Read More »

Taipy: Scenario Management in Data Pipeline Development

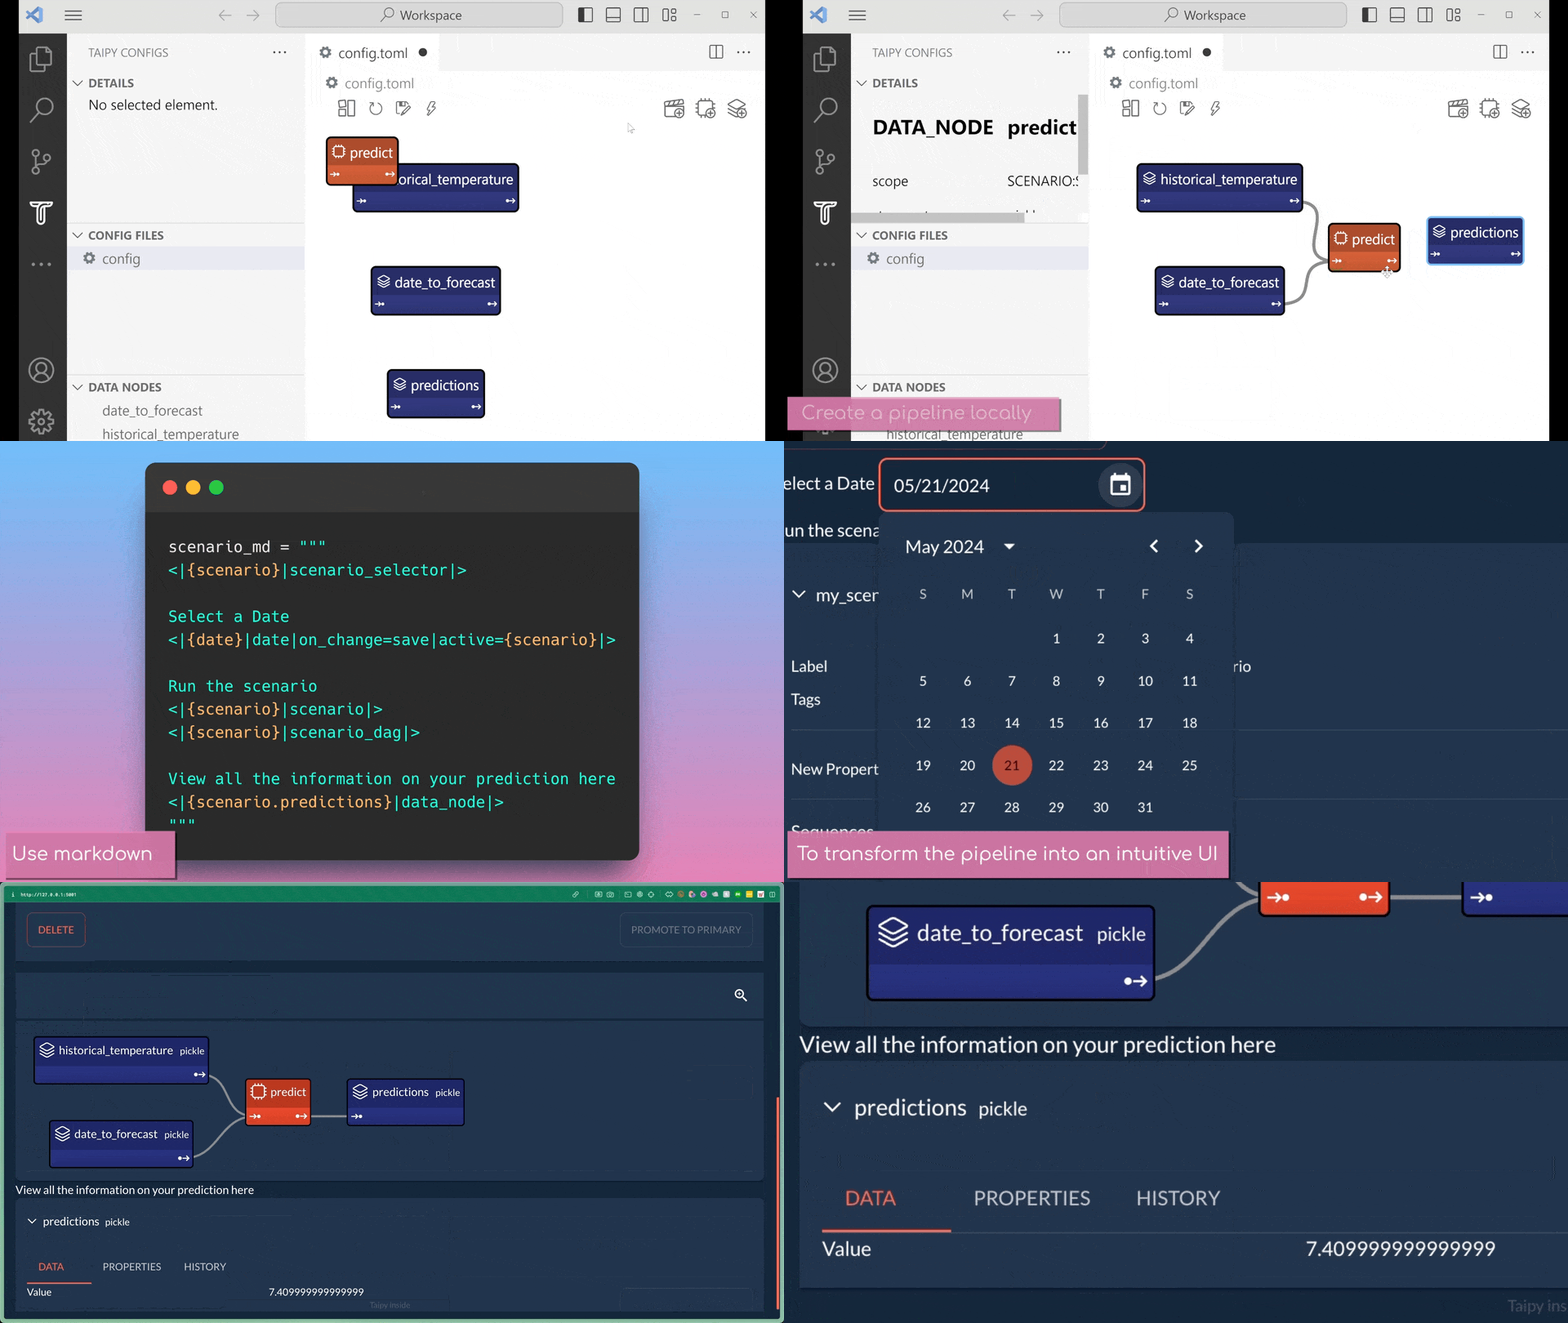
As data users, you may want to explore various scenarios by providing different inputs and observing how the metrics evolve.

Taipy enables you to prototype the pipeline locally on your machine, and then seamlessly transform it into an intuitive user interface, ready for use and share with your colleagues.

Link to Taipy.
Favorite

Taipy: Scenario Management in Data Pipeline Development Read More »

Streamline Your AI Development with KitOps Dev Mode

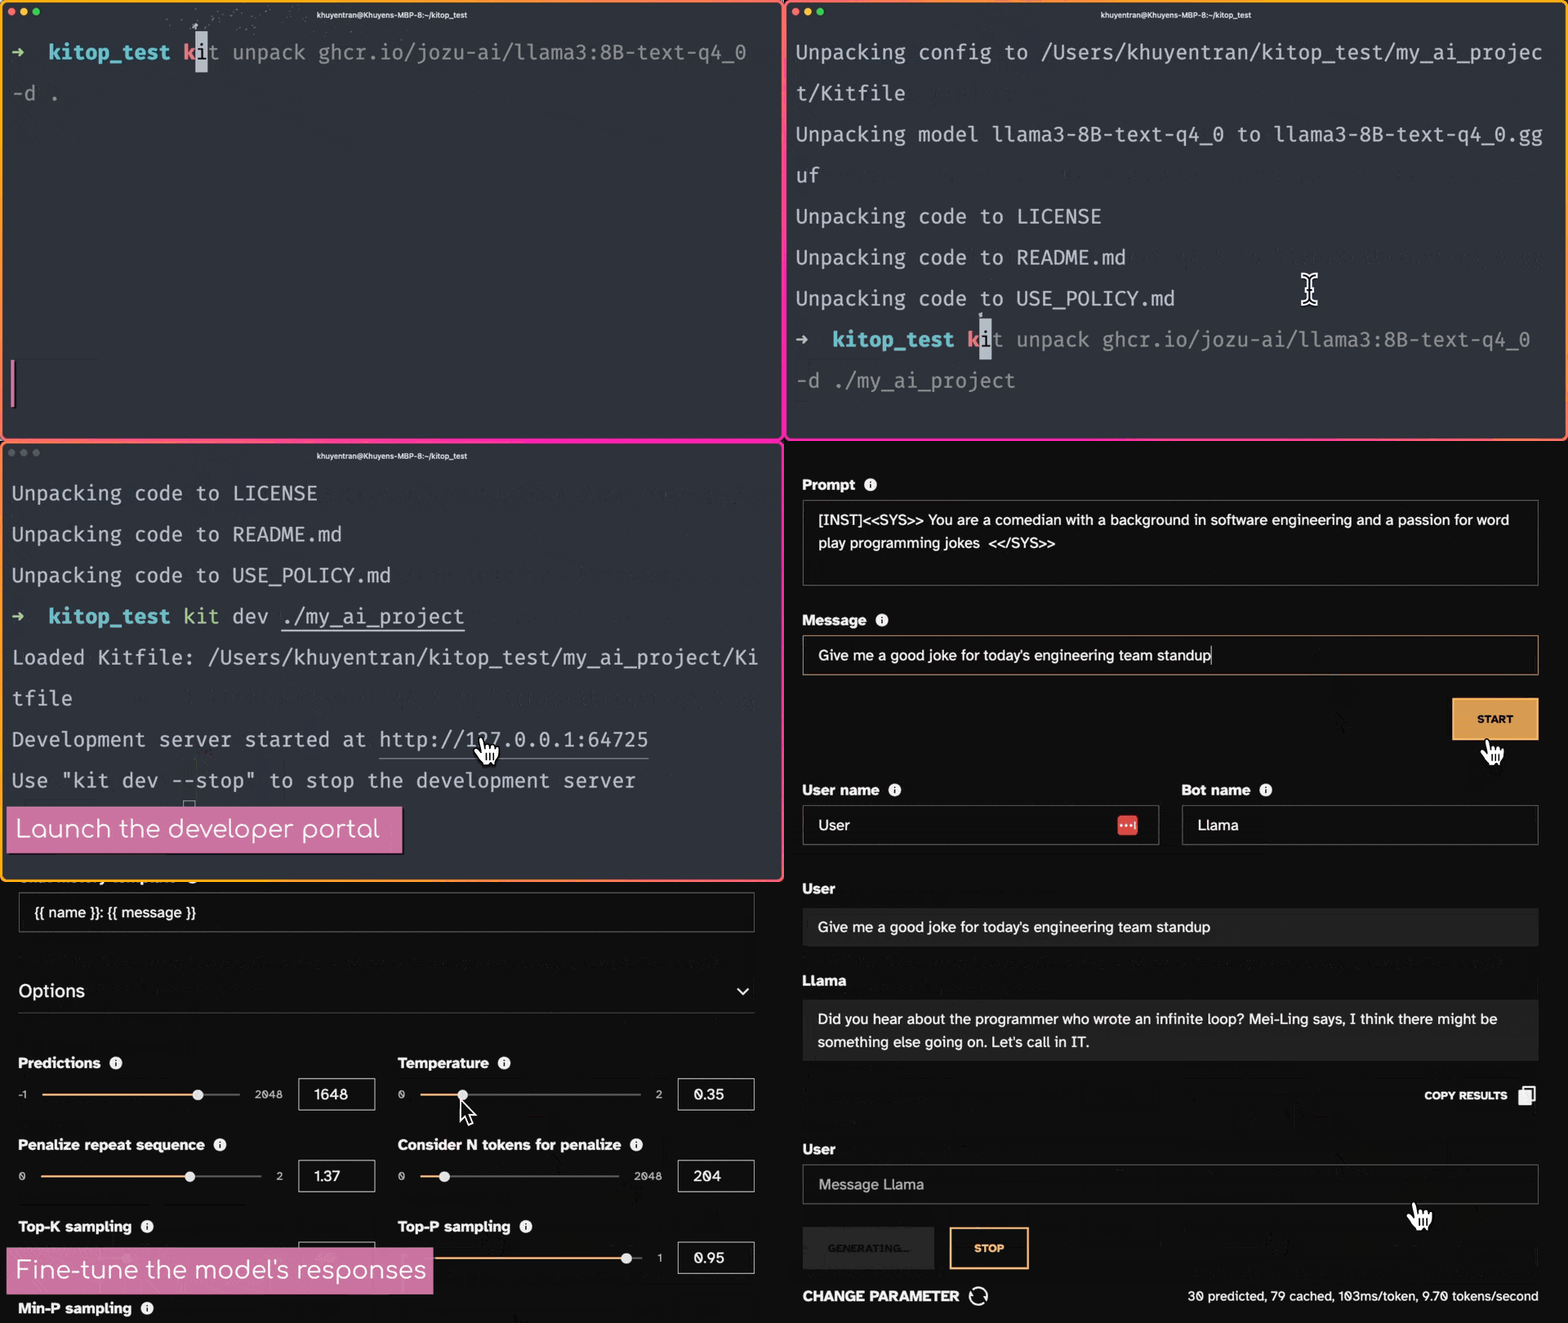
With KitOps Dev Mode, you can easily launch a local development portal for any large language model with just two command lines.

This user-friendly interface enables you to quickly experiment with different prompts and fine-tune the model’s responses, helping you bring AI-powered applications to market faster.

Link to KitOps.
Favorite

Streamline Your AI Development with KitOps Dev Mode Read More »

0
    0
    Your Cart
    Your cart is empty
    Scroll to Top

    Work with Khuyen Tran

    Work with Khuyen Tran