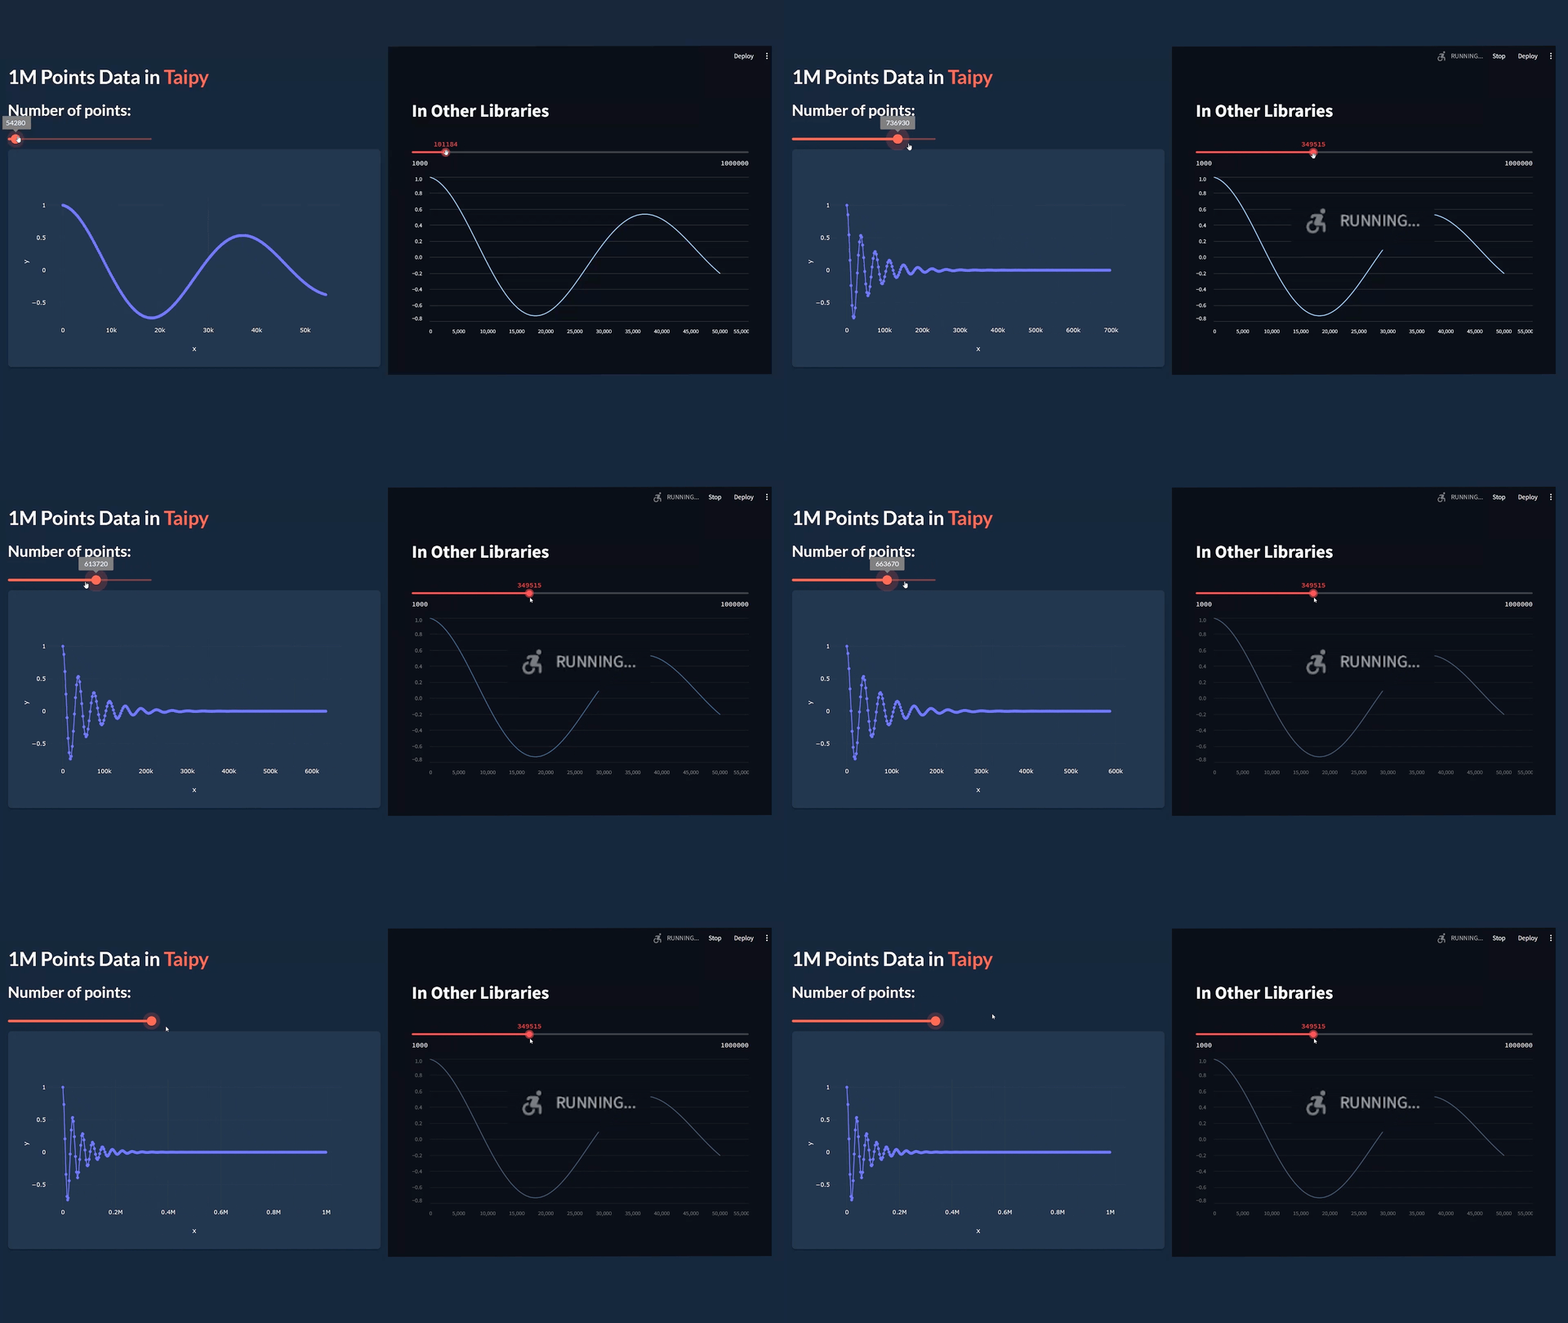
Streamlit re-runs the entire script when users interact with controls like sliders, which can cause performance issues with large datasets.
Taipy avoids this by storing variables in its State object for smoother updates.
You can build Taipy pages using either Markdown or Python syntax.
Markdown-Style Approach
from taipy.gui import Gui
from math import cos, exp

value = 10

page = """
# Taipy *Getting Started*

Value: <|{value}|text|>

<|{value}|slider|on_change=slider_moved|>

<|{data}|chart|>
"""

def slider_moved(state):
    state.data = compute_data(state.value)

def compute_data(decay:int)->list:
    return [cos(i/6) * exp(-i*decay/600) for i in range(100)]

data = compute_data(value)

if __name__ == "__main__":
    Gui(page).run(title="Dynamic chart")
Components:
- Text display:
<|{value}|text|> - Slider control:
<|{value}|slider|> - Data chart:
<|{data}|chart|>
How It Works:
- Initial value creates starting data
- Slider movement triggers
slider_moved - New data computed and chart updates
Python Builder Approach
from taipy.gui import Gui
import taipy.gui.builder as tgb
from math import cos, exp

value = 10

def compute_data(decay:int)->list:
    return [cos(i/6) * exp(-i*decay/600) for i in range(100)]

def slider_moved(state):
    state.data = compute_data(state.value)

with tgb.Page() as page:
    tgb.text(value="# Taipy Getting Started", mode="md")
    tgb.text(value="Value: {value}")
    tgb.slider(value="{value}", on_change=slider_moved)
    tgb.chart(data="{data}")

data = compute_data(value)

if __name__ == "__main__":
    Gui(page=page).run(title="Dynamic chart")
Components:
- Text:
tgb.text() - Slider:
tgb.slider() - Chart:
tgb.chart()
How It Works:
- Components created programmatically
- Same data flow as Markdown approach
- Real-time updates through State management


