Skip to content
Browse Tools
Blog
Book
Sponsor
Account
Login
Browse Tools
Blog
Book
Sponsor
Account
Login
👋 Contact Us
Data Analysis & Manipulation
Analyze Data
Manage Data
Feature Engineer
SQL
Machine Learning & AI
Machine Learning
Natural Language Processing
Time Series
LLM
Code Quality
Python Tips
Python Utilities
Code Optimization
DevOps
Testing
Git
Command Line
Environment Management
Better Outputs
Tools
NumPy
Pandas
Polars
PySpark
Delta Lake
DuckDB
Jupyter Notebook
Visualization & Reporting
Dashboard
Visualization
Workflow & Automation
Workflow Automation
Scrape Data
X
hvPlot: One Syntax for Bokeh, Matplotlib, and Plotly
Drag-and-Drop Visualizations with PyGWalker
Phoenix: Visualize High-Dimensional Data to Identify Performance Issues
From Text to Graphs: Enhancing Understanding with InstaGraph
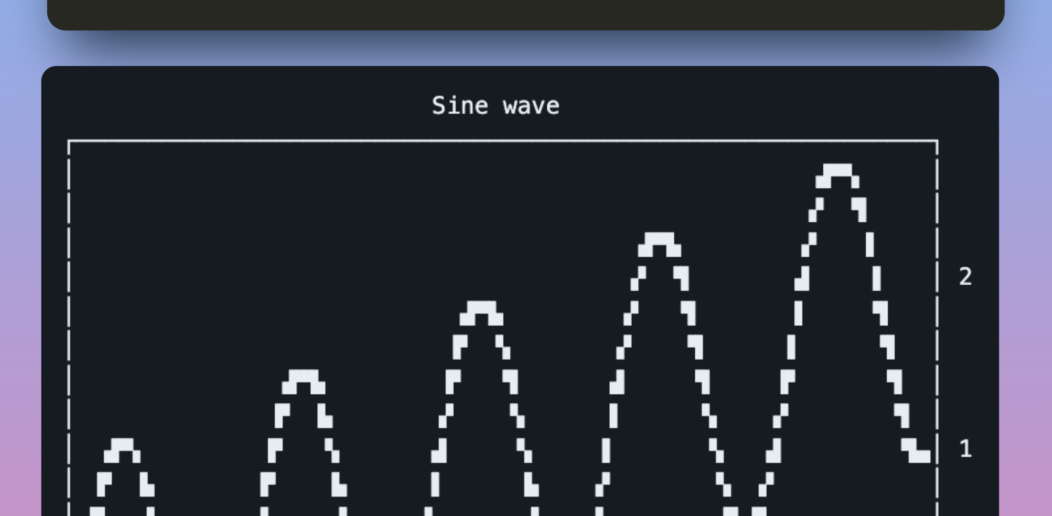
Uniplot: Terminal-Based Plotting for Enhanced Data Science Pipelines
LovelyPlots: Create Nice Matplotlib Figures for Presentations
Dtale: Quickly Gain Insights from Your Data
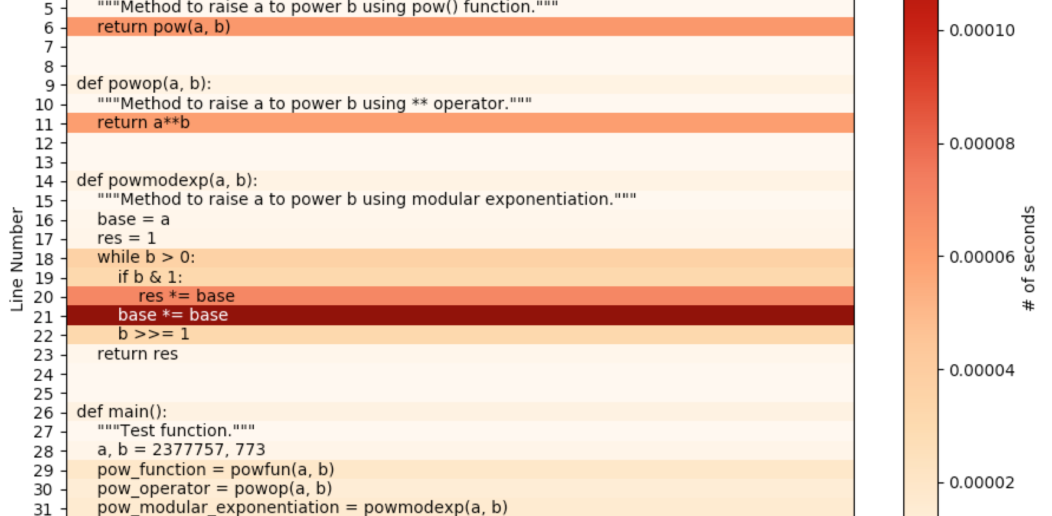
Simplify Code Profiling with Heatmap Visualization
gif: The Easiest Way to Animate Your matplotlib Plot
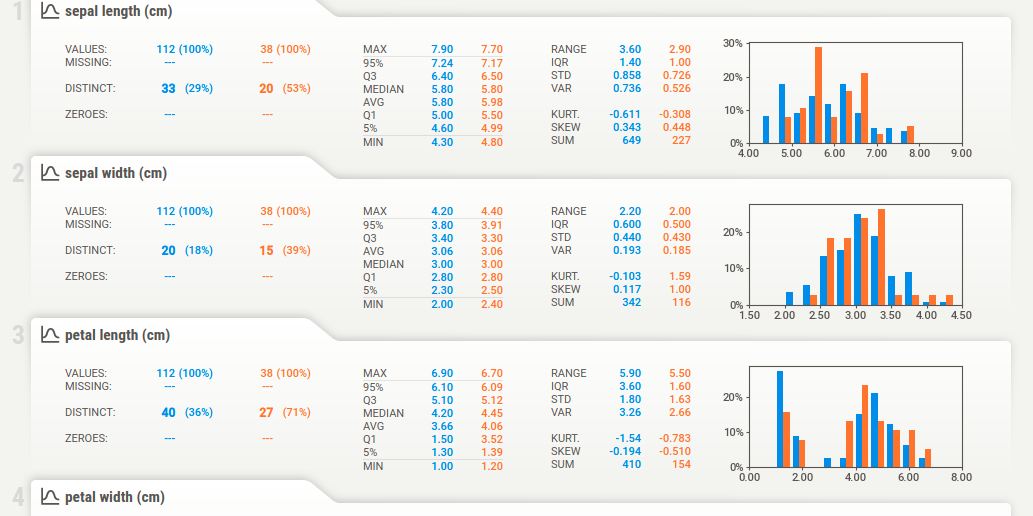
Sweetviz: Compare the Similar Features Between 2 Different Datasets
« Previous
Page
1
Page
2
Page
3
Page
4
Page
5
Page
6
Next »
Scroll to Top
Work with Khuyen Tran
Enter Your Total Budget
Please explain the goals of you campaign
Why Do you want to collaborate with Khuyen Tran
Add date preferences
Enter your contact details
Submit
Work with Khuyen Tran
Enter Your Total Budget
Please explain the goals of you campaign
Why Do you want to collaborate with Khuyen Tran
Add date preferences
Enter your contact details
Submit