Generic selectors
Exact matches only
Search in title
Search in content
Post Type Selectors
Filter by Categories
About Article
Analyze Data
Archive
Best Practices
Better Outputs
Blog
Code Optimization
Code Quality
Command Line
Daily tips
Dashboard
Data Analysis & Manipulation
Data Engineer
Data Visualization
DataFrame
Delta Lake
DevOps
DuckDB
Environment Management
Feature Engineer
Git
Jupyter Notebook
LLM
LLM
Machine Learning
Machine Learning
Machine Learning & AI
Manage Data
MLOps
Natural Language Processing
NumPy
Pandas
Polars
PySpark
Python Tips
Python Utilities
Python Utilities
Scrape Data
SQL
Testing
Time Series
Tools
Visualization
Visualization & Reporting
Workflow & Automation
Workflow Automation

Leverage Mermaid for Real-Time Git Graph Rendering

Table of Contents

Leverage Mermaid for Real-Time Git Graph Rendering

The Git graph helps developers visualize and understand the flow of Git operations, making it easier to discuss and share Git branching strategies.

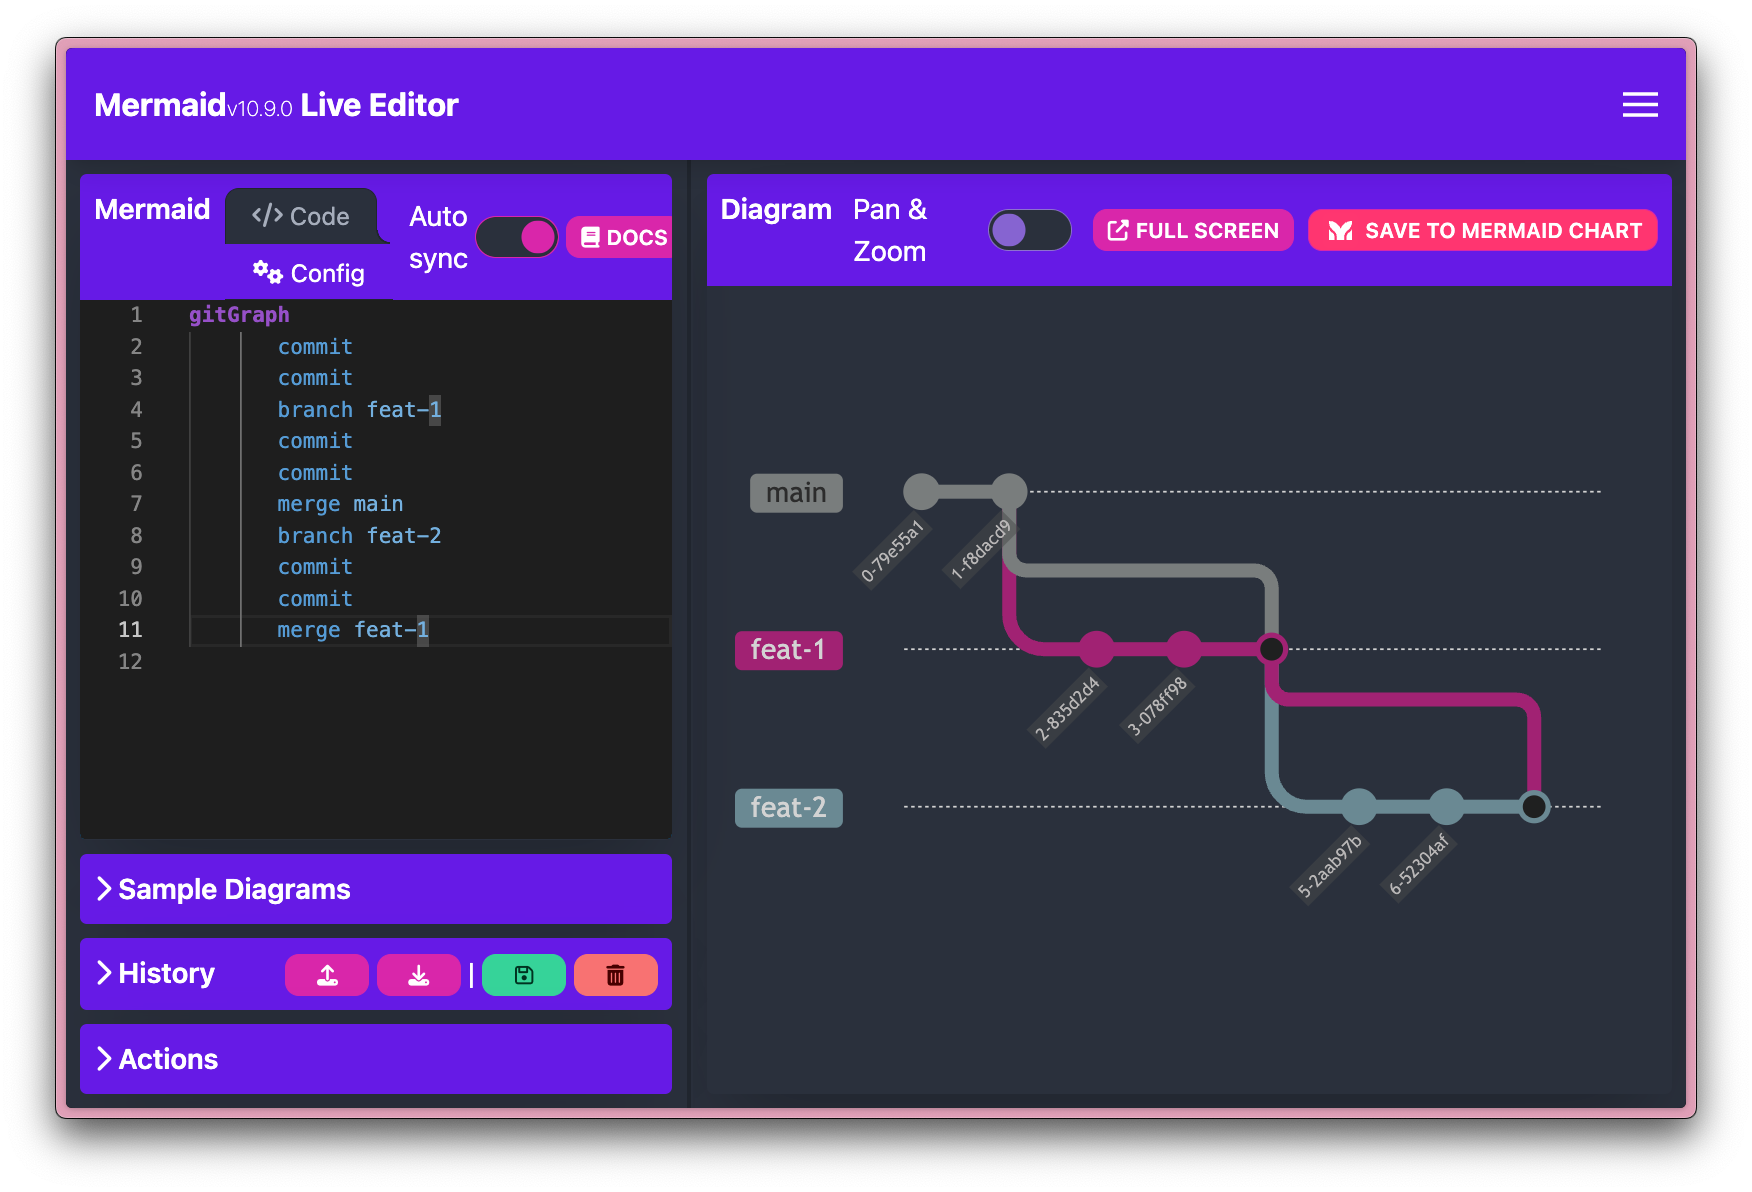
Mermaid enables real-time rendering of the Git graph through commands like merge, checkout, branch, and commit.

Example:

gitGraph
    commit
    commit
    branch feat-1
    commit
    commit
    checkout main
    branch feat-2
    commit
    commit
    merge feat-1

In this example, we start by creating two commits on the main branch. We then create a new branch feat-1 and make two commits on it. Next, we switch back to the main branch and create a new branch feat-2, making two commits on it. Finally, we merge the feat-1 branch into main.

The resulting graph shows the flow of these operations, with each branch and commit represented by a node. The merge command creates a new node that combines the changes from both branches.

Learn more about Gitgraph in Mermaid.

Leave a Comment

Your email address will not be published. Required fields are marked *

0
    0
    Your Cart
    Your cart is empty
    Scroll to Top

    Work with Khuyen Tran

    Work with Khuyen Tran