

Table of Contents
- Introduction
- Why Consider Polars?
- Setup
- Multi-Core Performance
- Lazy Evaluation (Only in Polars)
- Syntax Comparison
- Memory Efficiency
- Missing Features (Where Pandas Wins)
- Summary
- Final Thoughts
Introduction
Pandas has been the standard tool for working with tabular data in Python for many years. But as datasets get larger and performance becomes more important, Polars (an increasingly popular choice for handling data in Polars Python) is a faster alternative that uses multiple CPU cores.
This guide compares Polars and Pandas, highlighting where Polars shines and showing how to get started with it.
💻 Get the Code: Open the notebook in Google Colab to run it in your browser, or grab the source from GitHub.
Stay Current with CodeCut
Easy-to-digest articles on Python, AI, and open-source tools. Delivered twice a week.
Key Takeaways
Here’s what you’ll learn:
- Achieve 9× faster CSV reading with Polars’ multi-threaded architecture
- Reduce memory usage by 30-50% using Apache Arrow backend optimization
- Enable lazy evaluation for automatic query optimization and predicate pushdown
- Implement seamless migration from Pandas with similar API patterns
- Scale data processing without changing code using built-in parallel execution
Why Consider Polars?
Polars is a DataFrame library written in Rust, designed for high performance. Key advantages:
- Multi-threaded by default
- Lazy execution for optimization
- Low memory usage
- Strong support for Arrow and Parquet
Let’s explore how Polars improves upon Pandas with practical examples.
Setup
Install both libraries and generate a sample dataset for testing:
pip install pandas polars
To follow along with the examples, you can generate a large CSV file like this:
import pandas as pd
import numpy as np

# Create a large dataset
n_rows = 10_000_000
data = {
    "category": np.random.choice(["A", "B", "C", "D"], size=n_rows),
    "value": np.random.rand(n_rows) * 1000
}
df = pd.DataFrame(data)
This will create a large_file.csv with 10 million rows for performance testing.
Multi-Core Performance
Pandas uses multiple CPU cores for data processing, while Pandas relies on a single core. Thus, Polars manages larger datasets more efficiently and often performs operations faster than Pandas.

Let’s benchmark a few common operations using Pandas and Polars: reading CSVs, groupby, filter, and sort.
Timing Decorator
We define a reusable timing decorator to simplify benchmarking in this section:
import time
from functools import wraps

def timeit(operation_name):
    def decorator(func):
        @wraps(func)
        def wrapper(*args, **kwargs):
            start_time = time.time()
            result = func(*args, **kwargs)
            end_time = time.time()
            execution_time = end_time - start_time
            print(f"{operation_name} took {execution_time:.2f} seconds")
            return result, execution_time
        return wrapper
    return decorator
Plotting Setup
Let’s define a helper function to simplify chart creation for each operation.
import matplotlib.pyplot as plt
import seaborn as sns

def create_comparison_plot(pandas_time, polars_time, title, plt, sns):
    sns.barplot(
        hue=["Pandas", "Polars"],
        y=[pandas_time, polars_time],
        palette=["#E583B6", "#72BEFA"],
    )
    plt.title(f"{title} (seconds)")
    plt.ylabel("Time (s)")
    plt.show()
Reading CSV Files
Pandas:
@timeit("Pandas read_csv")
def read_pandas():
    return pd.read_csv("large_file.csv")

pandas_df, pandas_read_time = read_pandas()
Output:
Pandas read_csv took 1.38 seconds
Polars:
import polars as pl

@timeit("Polars read_csv")
def read_polars():
    return pl.read_csv("large_file.csv")

polars_df, polars_read_time = read_polars()
Output:
Polars read_csv took 0.15 seconds
create_comparison_plot(pandas_read_time, polars_read_time, "CSV Read Time")

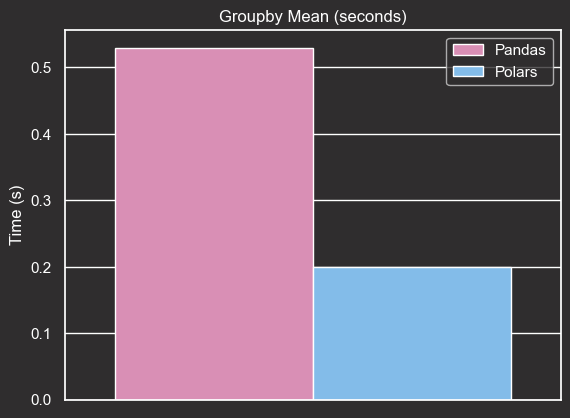
Groupby Mean
Pandas:
@timeit("Pandas groupby")
def pandas_groupby(df):
    return df.groupby("category")["value"].mean()

pandas_result, pandas_groupby_time = pandas_groupby(pandas_df)
Output:
Pandas groupby took 0.53 seconds
Polars:
@timeit("Polars groupby")
def polars_groupby(df):
    return df.group_by("category").agg(pl.col("value").mean())

polars_result, polars_groupby_time = polars_groupby(polars_df)
Output:
Polars groupby took 0.20 seconds
create_comparison_plot(pandas_groupby_time, polars_groupby_time, "Groupby Mean Time")
Filter Rows
Pandas:
@timeit("Pandas filter")
def pandas_filter(df):
    return df[df["value"] > 500]

pandas_filtered, pandas_filter_time = pandas_filter(pandas_df)
Output:
Pandas filter took 0.15 seconds
Polars:
@timeit("Polars filter")
def polars_filter(df):
    return df.filter(pl.col("value") > 500)

polars_filtered, polars_filter_time = polars_filter(polars_df)
Output:
Polars filter took 0.03 seconds
create_comparison_plot(pandas_filter_time, polars_filter_time, "Filter Rows Time")

Sort by Column
Pandas:
@timeit("Pandas sort")
def pandas_sort(df):
    return df.sort_values("value")

pandas_sorted, pandas_sort_time = pandas_sort(pandas_df)
Output:
Pandas sort took 2.74 seconds
Polars:
@timeit("Polars sort")
def polars_sort(df):
    return df.sort("value")

polars_sorted, polars_sort_time = polars_sort(polars_df)
Output:
Polars sort took 0.49 seconds
create_comparison_plot(pandas_sort_time, polars_sort_time, "Sort Time")

Observations
Polars consistently outperformed Pandas across all operations:
- CSV Reading: 9× faster
- Groupby: Over 2.5× faster
- Filtering: 5× faster
- Sorting: 5.5× faster
This performance advantage is largely due to Polars’ native Rust engine and multi-threaded execution. It’s especially valuable for large-scale data processing pipelines.
For SQL-based analytics that complement Polars’ performance advantages, see our DuckDB deep dive guide.
Lazy Evaluation (Only in Polars)
Pandas executes operations eagerly, which can be inefficient for large pipelines. For example:
(
    pd.read_csv("large_file.csv")
    .query('value > 100')
    .groupby('category', as_index=False)['value']
    .mean()
    .rename(columns={"value": "avg_value"})
)
This code is inefficient because:
- Full CSV Load: Pandas loads the entire file into memory, even rows or columns we won’t use.
- No Predicate Pushdown: The
.query()filter is applied after reading all rows, not during the read. - No Projection Pushdown: All columns are read from disk, even if we only use
valueandcategory.
Polars supports lazy evaluation, which plans and optimizes the entire computation graph before execution:
query = (
    pl.read_csv("large_file.csv").lazy()
    .filter(pl.col("value") > 100)
    .group_by("category")
    .agg(pl.col("value").mean().alias("avg_value"))
)

print(query.explain())
Output:
FILTER [(col("avg_value")) > (100.0)]
FROM
  AGGREGATE
    [col("value").mean().alias("avg_value")] BY [col("category")]
    FROM
    DF ["category", "value"]; PROJECT["value", "category"] 2/2 COLUMNS
Optimizations used by Polars:
- Lazy Execution: The computation is deferred and optimized before execution.
- Predicate Pushdown: Filters like
value > 100are applied during the scan, skipping irrelevant rows. - Projection Pushdown: Only necessary columns (
categoryandvalue) are read. - Single-Pass Execution: Operations can be executed in a streaming manner, improving performance.
The pipeline is only executed when .collect() is called:
result = query.collect()
result.head()
Output:
shape: (4, 2)
┌──────────┬────────────┐
│ category ┆ avg_value  │
│ ---      ┆ ---        │
│ str      ┆ f64        │
╞══════════╪════════════╡
│ A        ┆ 550.245739 │
│ C        ┆ 549.985808 │
│ D        ┆ 549.649933 │
│ B        ┆ 550.055504 │
└──────────┴────────────┘
Syntax Comparison
Both libraries offer expressive APIs, but Polars’ syntax is more functional and chainable, which makes it easier to write pipelines with multiple operations in a single expression.
Filtering rows
Pandas:
df_pd.query("value > 1000")
Polars:
df_pl.filter(pl.col("value") > 1000)
Selecting columns
Pandas:
df_pd[["category", "value"]]
Polars:
df_pl.select(["category", "value"])
Polars feels more like writing SQL pipelines, especially in lazy mode.
Chained operations
Pandas:
(df_pd.query("value > 1000")
 .groupby("category")["value"]
 .mean()
 .reset_index())
Polars:
(df_pl
 .filter(pl.col("value") > 1000)
 .group_by("category")
 .agg(pl.col("value").mean().alias("avg_value")))
Polars lets you chain operations together, which often makes code more readable and efficient.
Memory Efficiency
Polars has its own columnar and compact implementation optimized for performance. This design avoids Python object overhead, unlike Pandas.
df_pd.memory_usage(deep=True).sum() / 1e6  # MB
df_pl.estimated_size() / 1e6  # MB
Polars usually consumes less memory, especially with strings or categorical data.
Missing Features (Where Pandas Wins)
While Polars is fast, Pandas is still better at:
- Interoperability with other Python libraries (e.g.,
matplotlib,scikit-learn) - Rich ecosystem (e.g.,
pandas-profiling,pandasql) - More mature and flexible time series tools
Summary
When to Use Polars vs. Pandas
| Scenario | Use Polars ✅ | Use Pandas ✅ |
|---|---|---|
| Large datasets and file sizes | ✅ Yes | ⚠️ May struggle with memory |
| Fast CSV/Parquet I/O | ✅ Much faster | 🚫 Slower for large files |
| Multi-core performance | ✅ Built-in multi-threading | 🚫 Single-threaded by default |
| Lazy evaluation for optimized pipelines | ✅ Supported | 🚫 Not available |
| Low memory consumption | ✅ Apache Arrow backend | 🚫 Higher memory overhead |
| Integration with scikit-learn, statsmodels, etc. | 🚫 Limited | ✅ Excellent ecosystem integration |
| Flexible time series handling | 🚫 Basic support | ✅ Advanced and robust |
| Small-to-medium datasets | ⚠️ May be overkill | ✅ Simple and effective |
For scaling beyond single-machine processing, see our PySpark Pandas API guide.
Final Thoughts
Polars is not here to replace Pandas, but it’s an excellent choice when performance matters. If your workflows are slow or memory-bound, Polars can drastically reduce execution time without compromising expressiveness.
Tip: You can even mix both libraries. Load and process large files with Polars, then convert to Pandas when needed:
df_pd = df_pl.to_pandas()
For modern Python development best practices that complement Polars’ performance focus, see our UV package manager guide.
📚 Want to go deeper? Learning new techniques is the easy part. Knowing how to structure, test, and deploy them is what separates side projects from real work. My book shows you how to build data science projects that actually make it to production. Get the book →
Stay Current with CodeCut
Easy-to-digest articles on Python, AI, and open-source tools. Delivered twice a week.


2 thoughts on “Polars vs. Pandas: A Fast, Multi-Core Alternative for DataFrames”
Polars uses Apache Arrow under the hood, which is columnar and compact. It avoids Python object overhead, unlike Pandas.
Not quite. This was a common misconception. They’ve clarified it in the Polars docs.
Last bullet point:
https://docs.pola.rs/
Good catch! Fixed