Generic selectors
Exact matches only
Search in title
Search in content
Post Type Selectors
Filter by Categories
About Article
Analyze Data
Archive
Best Practices
Better Outputs
Blog
Code Optimization
Code Quality
Command Line
Daily tips
Dashboard
Data Analysis & Manipulation
Data Engineer
Data Visualization
DataFrame
Delta Lake
DevOps
DuckDB
Environment Management
Feature Engineer
Git
Jupyter Notebook
LLM
LLM
Machine Learning
Machine Learning
Machine Learning & AI
Manage Data
MLOps
Natural Language Processing
NumPy
Pandas
Polars
PySpark
Python Tips
Python Utilities
Python Utilities
Scrape Data
SQL
Testing
Time Series
Tools
Visualization
Visualization & Reporting
Workflow & Automation
Workflow Automation

Machine Learning

BentoML: Create an ML Powered Prediction Service in Minutes

You have just built a machine learning model with good performance. You decide to give this model to your team members so that they can develop an ML-powered application.

Wait, but how will you ship this model to your team members? Wouldn’t it be nice if your team members can use your model without setting up any environment or messing with your code? That is when BentoML comes in handy.

In my latest article, you will learn how to use BentoML to containerize and deploy your ML model in minutes.

Link to the article.

Link to the source code.
Favorite

BentoML: Create an ML Powered Prediction Service in Minutes Read More »

Bayesian Linear Regression with Bambi

When fitting a regression line to sample data, instead of getting one single regression line, wouldn’t it be nice if you can get a distribution of predictions instead?

That is when Bayesian linear regression comes in handy. By creating a Bayesian linear regression model, we are able to create the intervals where most predictions lie given a value of 𝑥.

In my latest article, you will learn how to build Bayesian linear regression in several lines of code using Bambi.

Link to the article.Link to the source code.
Favorite

Bayesian Linear Regression with Bambi Read More »

Plot a Pretty and Comprehensible Confusion Matrix in Python

It can be difficult to understand a confusion matrix, especially when there are many classes in the target. To make your confusion matrix prettier and easier to understand, use pretty_confusion_matrix.

The code is written by wagnerbhbr. I turned this code into a PyPI package so that it can be used by anybody.

Link to pretty_confusion_matrix.

My previous tips on data visualization.
Favorite

Plot a Pretty and Comprehensible Confusion Matrix in Python Read More »

Evidently: Detect and Visualize Data Drift

Data drift is unexpected changes in model input data that can lead to model performance degradation. Since your code is built around the characteristics of your data, it is important to detect data drift when it occurs.

Evidently allows you to do exactly in a few lines of Python code. In the code below, I use Evidently to detect changes in feature distribution.

Code to create the report above.

Link to Evidently.
Favorite

Evidently: Detect and Visualize Data Drift Read More »

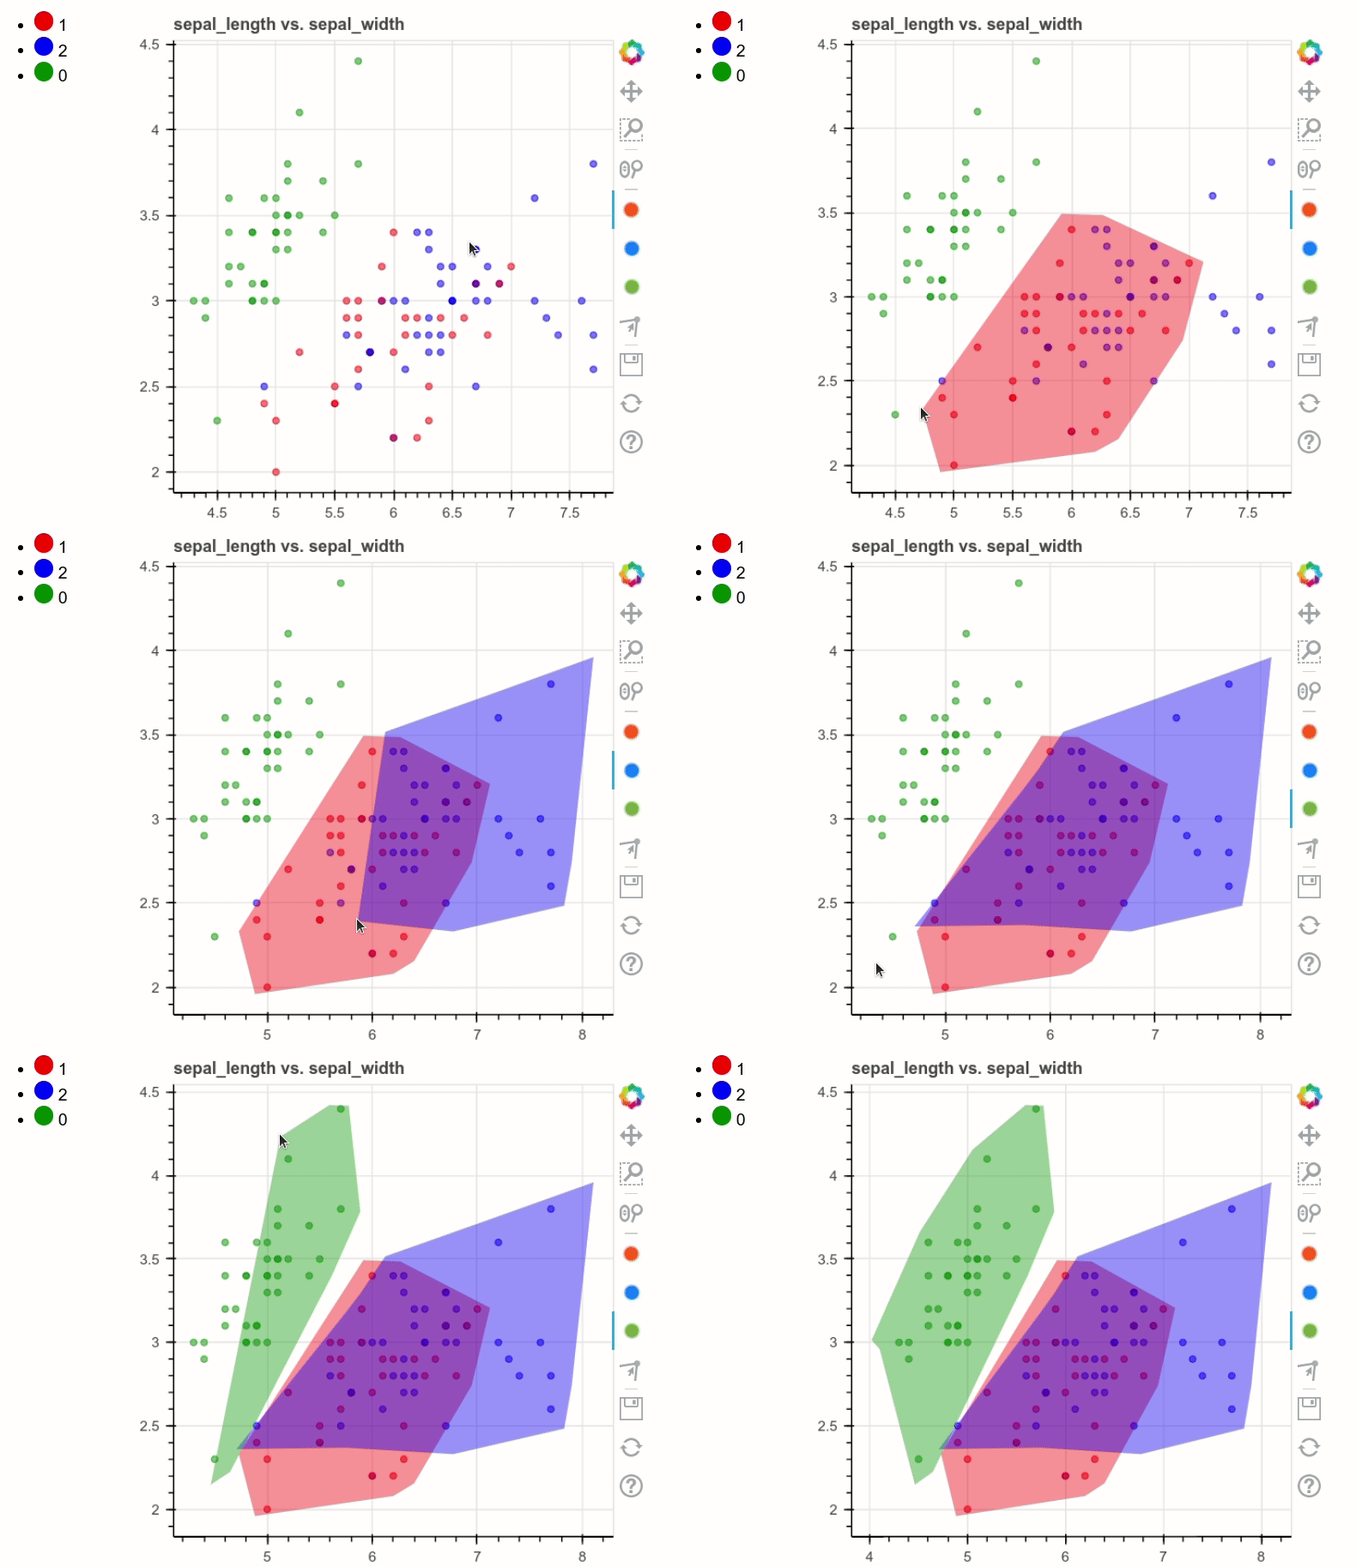
human-learn: Create a Human Learning Model by Drawing

Nowadays, data scientists often give machine learning model data with labels so that it can figure out the rules for labeling new data.
This is convenient, but some information may be lost in this process. It is also difficult to understand why the machine learning model comes up with a particular prediction.
Instead of letting a machine learning model figure out everything, is there a way that we can use our domain knowledge to set the rules for data labeling?
Yes, that can be done with human-learn. In my latest article, you will learn how to use human-learn to label your data by drawing on your dataset.
Link to the article.
Link to the source code.Favorite

human-learn: Create a Human Learning Model by Drawing Read More »

Weight and Biases: Compare the performance between different models if you run one model on different data

It can be difficult to compare the performance between different models if you run one model on different data. Pretty happy to see clearly the comparison in performance between different model versions with Weight and Biases. The graphs shown below indicate the average performance of different models on different metricsFavorite

Weight and Biases: Compare the performance between different models if you run one model on different data Read More »

0
    0
    Your Cart
    Your cart is empty
    Scroll to Top

    Work with Khuyen Tran

    Work with Khuyen Tran