
Table of Contents
- Introduction
- What Is the i-have-adhd Plugin?
- Success Conditions for Using the Plugin
- Setup
- How I Tested It
- Test Results
- Should You Install It?
- Run the Test Yourself
- References
- Related Tutorials
Introduction
Have you ever received an answer from your coding agent that was correct but hard to scan?
This happens to me often in Claude Code. The answer may be useful, but the important parts are buried in long paragraphs, so I spend extra time figuring out what Claude Code is doing, why it chose that path, and what I should do next.
This matters because if I cannot quickly see the agent’s reasoning and next action, I am more likely to miss a suggestion or change that does not fit what I asked for.
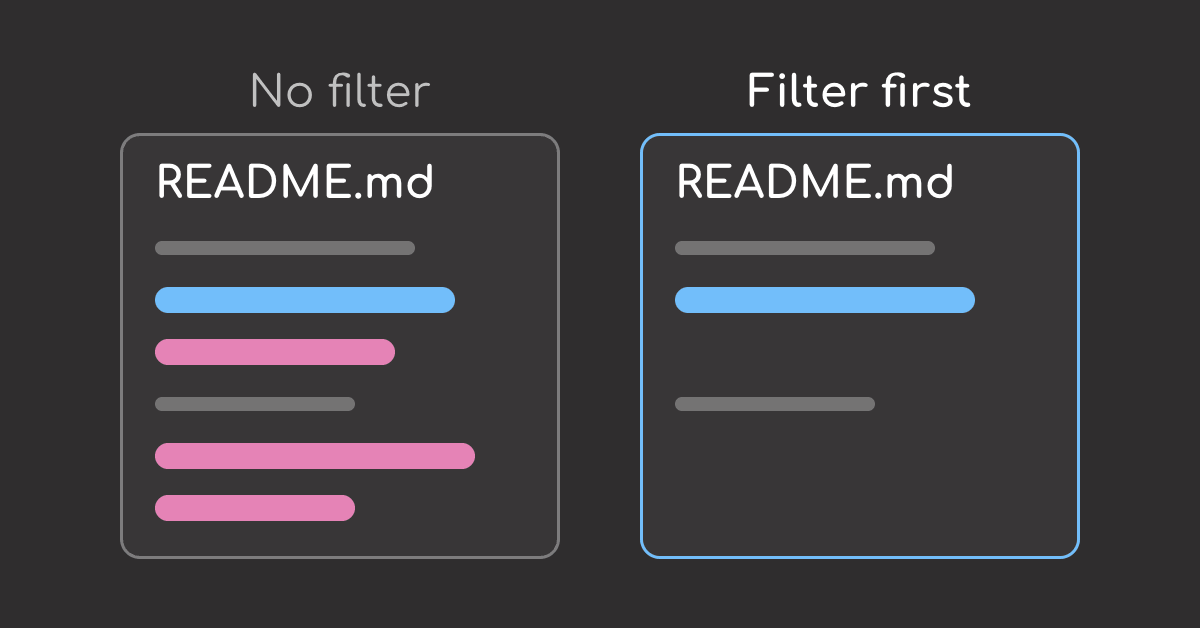
The i-have-adhd plugin claims to solve this by making coding-agent answers more scannable and action-first.
The claim is appealing, but I wanted evidence. So I ran a small A/B test to compare Claude Code with the plugin off and on.
This article walks through the experiment and the results so you can decide whether the plugin is worth installing.
💻 Get the Code: Get the runner, prompts, raw outputs, and metrics from the GitHub companion folder.
Stay Current with CodeCut
Easy-to-digest articles on Python, AI, and open-source tools. Delivered twice a week.
What Is the i-have-adhd Plugin?
i-have-adhd is a coding-agent plugin that makes responses easier to scan and act on. It does this by nudging the agent to:
| Rule | Why it matters |
|---|---|
| Put the next action first | The reader can see the recommended action before reading the explanation. |
| Use numbered steps for multi-step answers | The order of work is clear. |
| Limit long lists to the five most useful items | The reader has fewer options to sort through. |
| Skip unnecessary context | The answer stays focused on the decision or action. |
| End with one concrete follow-up | The reader knows what to do next without asking another question. |
If you need machine-readable structure instead of human-scannable answers, my structured LLM output tools comparison covers schema-based approaches.
Success conditions for using the plugin
I did not want to measure length alone. For the plugin to be worth using, it had to pass these checks:
- Is the answer easier to scan?
- Is the important information easier to find?
- Is useful detail still included?
- Does a detailed prompt still get a detailed answer?
Setup
Here is the test environment:
| Item | Value |
|---|---|
| Claude Code | 2.1.251 |
| Model | Claude Opus 5 |
| Operating system | macOS 25.6 |
| Machine | Apple M5 Pro, 64 GB |
| Plugin | i-have-adhd v0.2.0 |
For installation instructions for the plugin, refer to the setup section in the GitHub README.
How I Tested It
Controlled Settings
I compared Claude Code with the plugin off and on. To keep the comparison fair, every run used:
- Same model
- Same prompt
- Same default output style
Each prompt was run five times in each condition.
Run Command
Each run used the same command to remove avoidable sources of variation:
claude -p "$prompt"runs a fresh, single-turn Claude Code response.--permission-mode acceptEditsprevents permission handling from changing between runs.outputStyle: "default"keeps the baseline response style fixed.learning-output-style@claude-plugins-official: falsedisables a second output-style plugin that could change the answer format.
claude -p "$prompt" \
  --permission-mode acceptEdits \
  --settings '{"outputStyle":"default",
               "enabledPlugins":{"learning-output-style@claude-plugins-official":false}}' \
  < /dev/null
With those settings fixed, the only thing I changed was whether the plugin was on or off.
Plugin Switch
For this Claude Code experiment, I controlled the plugin with one marker file: ~/.claude/.i-have-adhd-always.
- Creating the file turned the plugin on.
- Removing the file turned the plugin off.
# Plugin on: a SessionStart hook reads this sentinel and injects the ruleset
touch ~/.claude/.i-have-adhd-always

# Plugin off: same model, same prompt, no ruleset
rm ~/.claude/.i-have-adhd-always
The metrics
To make the comparison repeatable, I measured each answer with simple text-based metrics instead of relying only on manual reading.
Here are the metrics I will use:
| Metric | What it tells me |
|---|---|
| Prose word count | How much explanation the reader has to read, excluding code blocks. |
| Non-blank lines | How much vertical space the answer takes on screen. |
| Total list items | How many choices the reader has to scan before deciding what matters. |
| Ends with a next action | Whether the answer gives the reader a concrete thing to do next. |
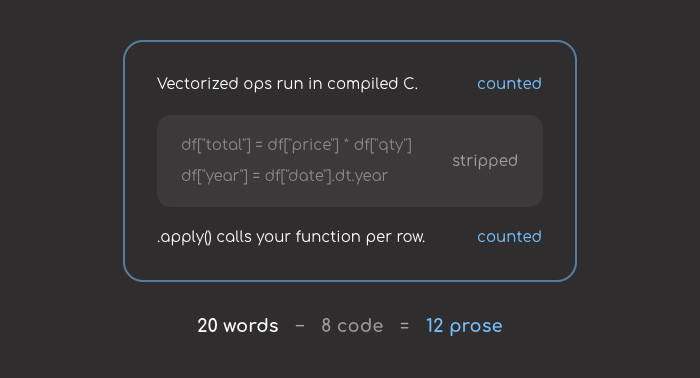
For prose word count, I stripped fenced code blocks first then counted the words.
prose = strip_code_blocks(answer)
prose_word_count = len(prose.split())
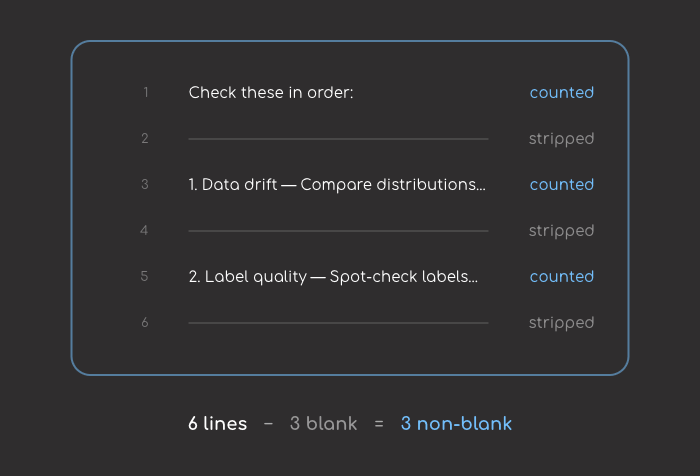
For non-blank lines, I split each answer by line breaks, removed empty lines, and counted the remaining lines.
nonblank_lines = sum(bool(line.strip()) for line in answer.splitlines())
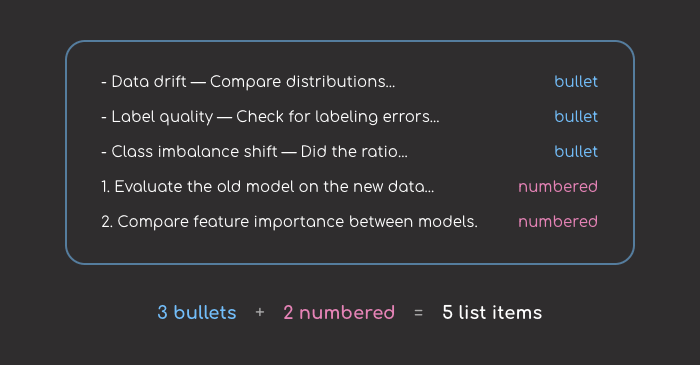
For total list items, I counted Markdown bullet lines and numbered-step lines separately, then added them.
bullet_lines = count_lines(answer, r"^\s*[-*]\s")
numbered_lines = count_lines(answer, r"^\s*\d+\.")
total_list_items = bullet_lines + numbered_lines
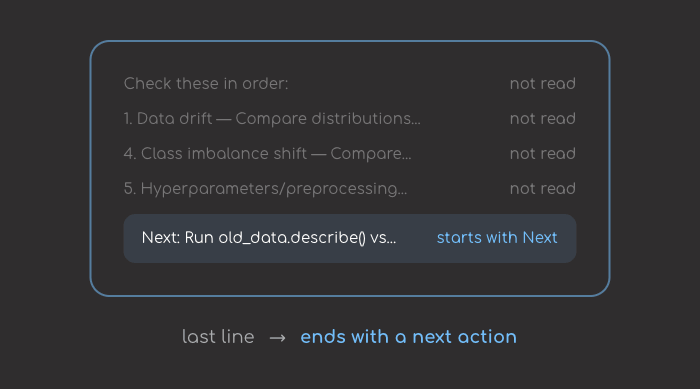
For the final-action check, I looked at the last two non-blank lines and marked the answer as actionable if one of them started with Next or **Next:**:
ends_with_next_action = starts_with_next(last_two_nonblank_lines(answer))
Together, these metrics tell me whether the answer is shorter and easier to scan.
The full experiment source is in run_ab.sh.
The three prompts
I tested the plugin on three prompts: two where the agent had to choose among several possible causes, and one where I explicitly asked for a detailed explanation.
Prompts 1 and 2 are diagnostic. They check whether the plugin makes an answer easier to scan when the question has several plausible causes:
Prompt 1: My model accuracy dropped after I retrained it on the new data. What should I look at?
Prompt 2: Our nightly ETL job started taking 3 hours instead of 40 minutes. Where should I start looking?
Prompt 3 asks for depth. It checks whether the plugin still gives enough detail when the reader explicitly asks for an in-depth explanation:
Prompt 3: Explain the difference between .apply() and vectorized operations in pandas, and when .apply() is actually the right choice. I want enough detail to decide.
Test Results
Prompt 1: Model accuracy dropped after retraining
The first prompt was:
My model accuracy dropped after I retrained it on the new data. What should I look at?
Here are the median results across five runs:
| Metric | Default | With the plugin |
|---|---|---|
| Prose words | 323 | 170 |
| Non-blank lines | 19 | 8 |
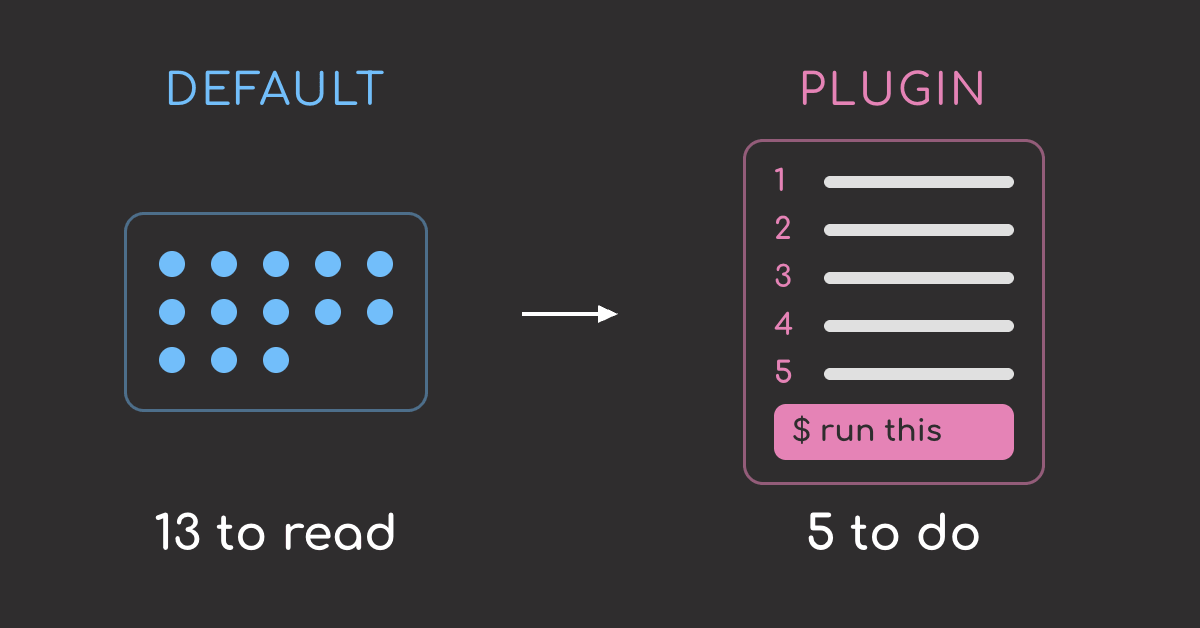
| List items | 13 | 5 |
| Runs ending with a next action | 0 of 5 | 5 of 5 |
Default answer
The default answer looked like this. I shortened the answer with .... See the full default answer for the complete response:
Here are the key things to investigate, roughly in order of likelihood:

## Data Issues (check first)
- **Data drift** — Compare distributions of features and target between old and new data. Shifted distributions are the most common cause.
- **Label quality** — Check for labeling errors, inconsistent annotation guidelines, or changed label definitions in the new data.
...

## Preprocessing / Pipeline Issues
- **Feature engineering changes** — Were any transformations, scalers, or encoders refit on the new data? A scaler fit on different distributions can hurt.
...

## Training Issues
- **Train/test split** — Are you evaluating on the same test set, or a new one? A harder test set looks like a worse model.
...

## Quick Diagnostic Steps

1. **Evaluate the old model on the new test data** — if it also drops, the data shifted, not the training.
...

The single most informative step is #1: test your old model on the new data. That tells you immediately whether the problem is the data or the training.

Want me to help you write code to diagnose any of these?
Plugin answer
The plugin answer:
Check these in order:

1. **Data drift** — Compare distributions of key features between old and new data. Plot histograms or run a KS test. If the new data looks different, that's your likely cause.

2. **Label quality** — Spot-check labels in the new data for errors, inconsistencies, or a shifted class distribution. Even a small % of mislabeled examples can tank accuracy.

3. **Train/test leakage lost** — If the old model accidentally had leakage that inflated metrics, retraining on clean data will look like a drop. Verify your old eval was legit.

4. **Class imbalance shift** — Compare class ratios old vs new. A shift from 50/50 to 90/10 changes what "accuracy" means. Check per-class precision/recall, not just overall accuracy.

5. **Hyperparameters/preprocessing mismatch** — Confirm the same feature engineering, scaling, and hyperparameters were used. A missing normalization step or changed default can silently break things.

**Next:** Run `old_data.describe()` vs `new_data.describe()` side by side and check for columns with large mean/std shifts. That's the fastest way to spot data drift.
Nothing essential disappeared. Data drift, label quality, leakage, class imbalance, and preprocessing still appear.
But the plugin answer is much easier to scan for the following reasons:
- Condensed list: the answer reduced many bullets across multiple sections into five focused checks, making it easier to act on.
- Clear order: the five checks were ranked, so the user knew which one to try first.
- Concrete next step: the answer closed with one action the reader could take immediately.
Prompt 2: ETL job slowed from 40 minutes to 3 hours
The second prompt was:
Our nightly ETL job started taking 3 hours instead of 40 minutes.
Where should I start looking?
Here are the median results:
| Metric | Default | With the plugin |
|---|---|---|
| Prose words | 257 | 222 |
| Non-blank lines | 26 | 17 |
| List items | 13 | 5 |
| Runs ending with a next action | 0 of 5 | 5 of 5 |
Default answer
The full default answer listed five broad headings, each with several bullets:
Here's a systematic approach, ordered by most common culprits:

## 1. Data Volume Changes
...

## 2. Database / Query Performance
...

## 3. Resource Contention
...

## 4. Code / Config Changes
...

## 5. Infrastructure Changes
...

## Where to start concretely
...
Near the end, it gave the highest-value action:
The single highest-value action: **find which step in the pipeline got slower**. Going from 40min to 3hr is a ~4.5x slowdown — that's usually one or two steps, not everything uniformly slower. Once you isolate the step, the root cause is usually obvious.
That is useful advice, but it comes after a long list of possible causes, making it easier to miss and slower to act on.
Plugin answer
The full plugin answer started with an action:
**Run this first** to find what changed recently:

```bash
# Check git log for ETL-related changes around when slowdown started
git log --since="1 week ago" --oneline -- '**/etl*' '**/pipeline*' '**/transform*'
```
Then it listed exactly five ranked causes:
## 5 most likely causes, ranked

1. **Data volume spike** — Check row counts for source tables...

2. **Missing or dropped index** — A schema migration may have dropped an index...

3. **New upstream schema / join explosion** — A changed join key or added NULL values can silently turn an inner join...

4. **Resource contention** — Another job now overlaps the ETL window...

5. **Code change in transform logic** — A recent commit added ...
And then the quick diagnostic steps:
## Quickest diagnostic

Add timing around each ETL phase (extract, transform, load) if you don't already have it. The phase that grew from minutes to hours tells you exactly where to dig.

```python
# Minimal example
import time
for phase in [extract, transform, load]:
    start = time.time()
    phase()
    print(f"{phase.__name__}: {time.time() - start:.1f}s")
```
Finally, it gave the highest-value action:
**Next step:** Check whether this is a data problem or a code problem — compare today's source row counts against last week's. If counts are similar, focus on indexes and recent code changes.
Even though the length is similar, the output is more readable because of the following:
- Fewer items: thirteen list items became five, reducing the amount of information the user had to compare.
- Ranked checks: the plugin ordered the causes, so the user could start with the most likely checks first.
- Action first: a runnable command appeared before the explanation, making the answer useful even when skimmed.
Prompt 3: pandas .apply() vs vectorized operations
The third prompt was:
Explain the difference between .apply() and vectorized operations in pandas,
and when .apply() is actually the right choice. I want enough detail to decide.
This prompt tested whether the plugin still gives enough explanation when the user explicitly asks for depth.
| Metric | Default | With the plugin |
|---|---|---|
| Prose words | 426 | 359 |
| Non-blank lines | 61 | 50 |
| List items | 5 | 8 |
| Bullet lines | 0 | 3 |
| Numbered lines | 0 | 5 |
| Runs ending with a next action | 0 of 5 | 5 of 5 |
The plugin answer is 16% shorter, but the table alone cannot tell us whether useful explanation was lost. To check that, we need to look at how both answers were organized.
Default answer
The full default answer opened with the concept, then moved through performance, use cases, decision rules, and traps:
## `.apply()` vs Vectorized Operations in Pandas

### Vectorized operations
Vectorized operations run in compiled C/NumPy under the hood...

### What `.apply()` actually does
`.apply()` is a loop in disguise...

### Performance hierarchy (fastest to slowest)

| Approach | Relative speed | Notes |
|---|---|---|
| NumPy / pandas vectorized ops | **1x** (baseline) | `.str`, `.dt`, arithmetic, `np.where`, `pd.cut` |
...

### When `.apply()` is the right choice

**1. Complex logic that genuinely can't be vectorized**
...

### Decision rule
Ask yourself: ...

### Common traps
...
Plugin answer
The full plugin answer covered the same core ideas, but reorganized the sections, trimmed some extra material, and kept the final action explicit:
## Vectorized ops vs `.apply()` in pandas
Vectorized operations run in compiled C/NumPy...

### Speed difference
Vectorized arithmetic: 1x baseline
Row-wise `.apply()`: 50-200x slower

### Why vectorized is faster
1. No per-element Python overhead
2. Cache-friendly memory access
3. SIMD / CPU optimizations

### When to use vectorized (most of the time)
Arithmetic, conditionals, string ops, datetime ops, aggregations...

### When `.apply()` is actually the right choice
1. Complex row logic that can't be expressed as array ops
2. GroupBy with custom aggregation
3. Small DataFrames where speed doesn't matter
4. Operating on non-numeric/irregular data
5. Prototype/exploration

Next: pick one `.apply()` call in your code and check if it fits the vectorized alternatives above.
What changed in the plugin answer:
- The comparison appears upfront, so the reader sees the core difference before reading examples.
- It removes extra background and keeps the answer tied to the main question: which approach should I use, and when?
- Extra material is trimmed. The default answer includes common traps, while the plugin answer leaves that out to keep the answer focused.
- It ends with a specific next step, so the user knows how to apply the advice to their own code.
The answer became shorter, but not shallow. It still kept the core explanation needed to understand the concept.
Should You Install It?
After this test, I decided to keep the plugin installed because it makes Claude Code answers easier for me to scan and act on.
There are two things to keep in mind.
First, the rules may become less visible after a long coding session with many files, tool outputs, and previous turns. When that happens, a short reminder or a fresh session may help.
Second, there is a small token cost because the plugin adds its rules to the session context. But the rules are short, so the cost should be small.
Run the Test Yourself
The experiment files are available in the GitHub companion folder.
Run the batch:
git clone https://github.com/khuyentran1401/codecut-blog.git
cd codecut-blog/i-have-adhd-plugin-output-ab
bash run_ab.sh
The script runs the full A/B test:
- Runs all prompts with the plugin on.
- Runs the same prompts with the plugin off.
- Saves the raw answers in
transcripts/.
Stay Current with CodeCut
Easy-to-digest articles on Python, AI, and open-source tools. Delivered twice a week.
References
- i-have-adhd
evals/rubric.md(ayghri, 2026): the evaluation rubric weights correctness, autonomy, actionability, safety, and concision. - i-have-adhd
evals/cases.jsonl(ayghri, 2026): the maintainers’ case taxonomy that separates action-oriented cases from cases where brevity can remove needed detail.